Disney Results Presentation Deck
$10.9
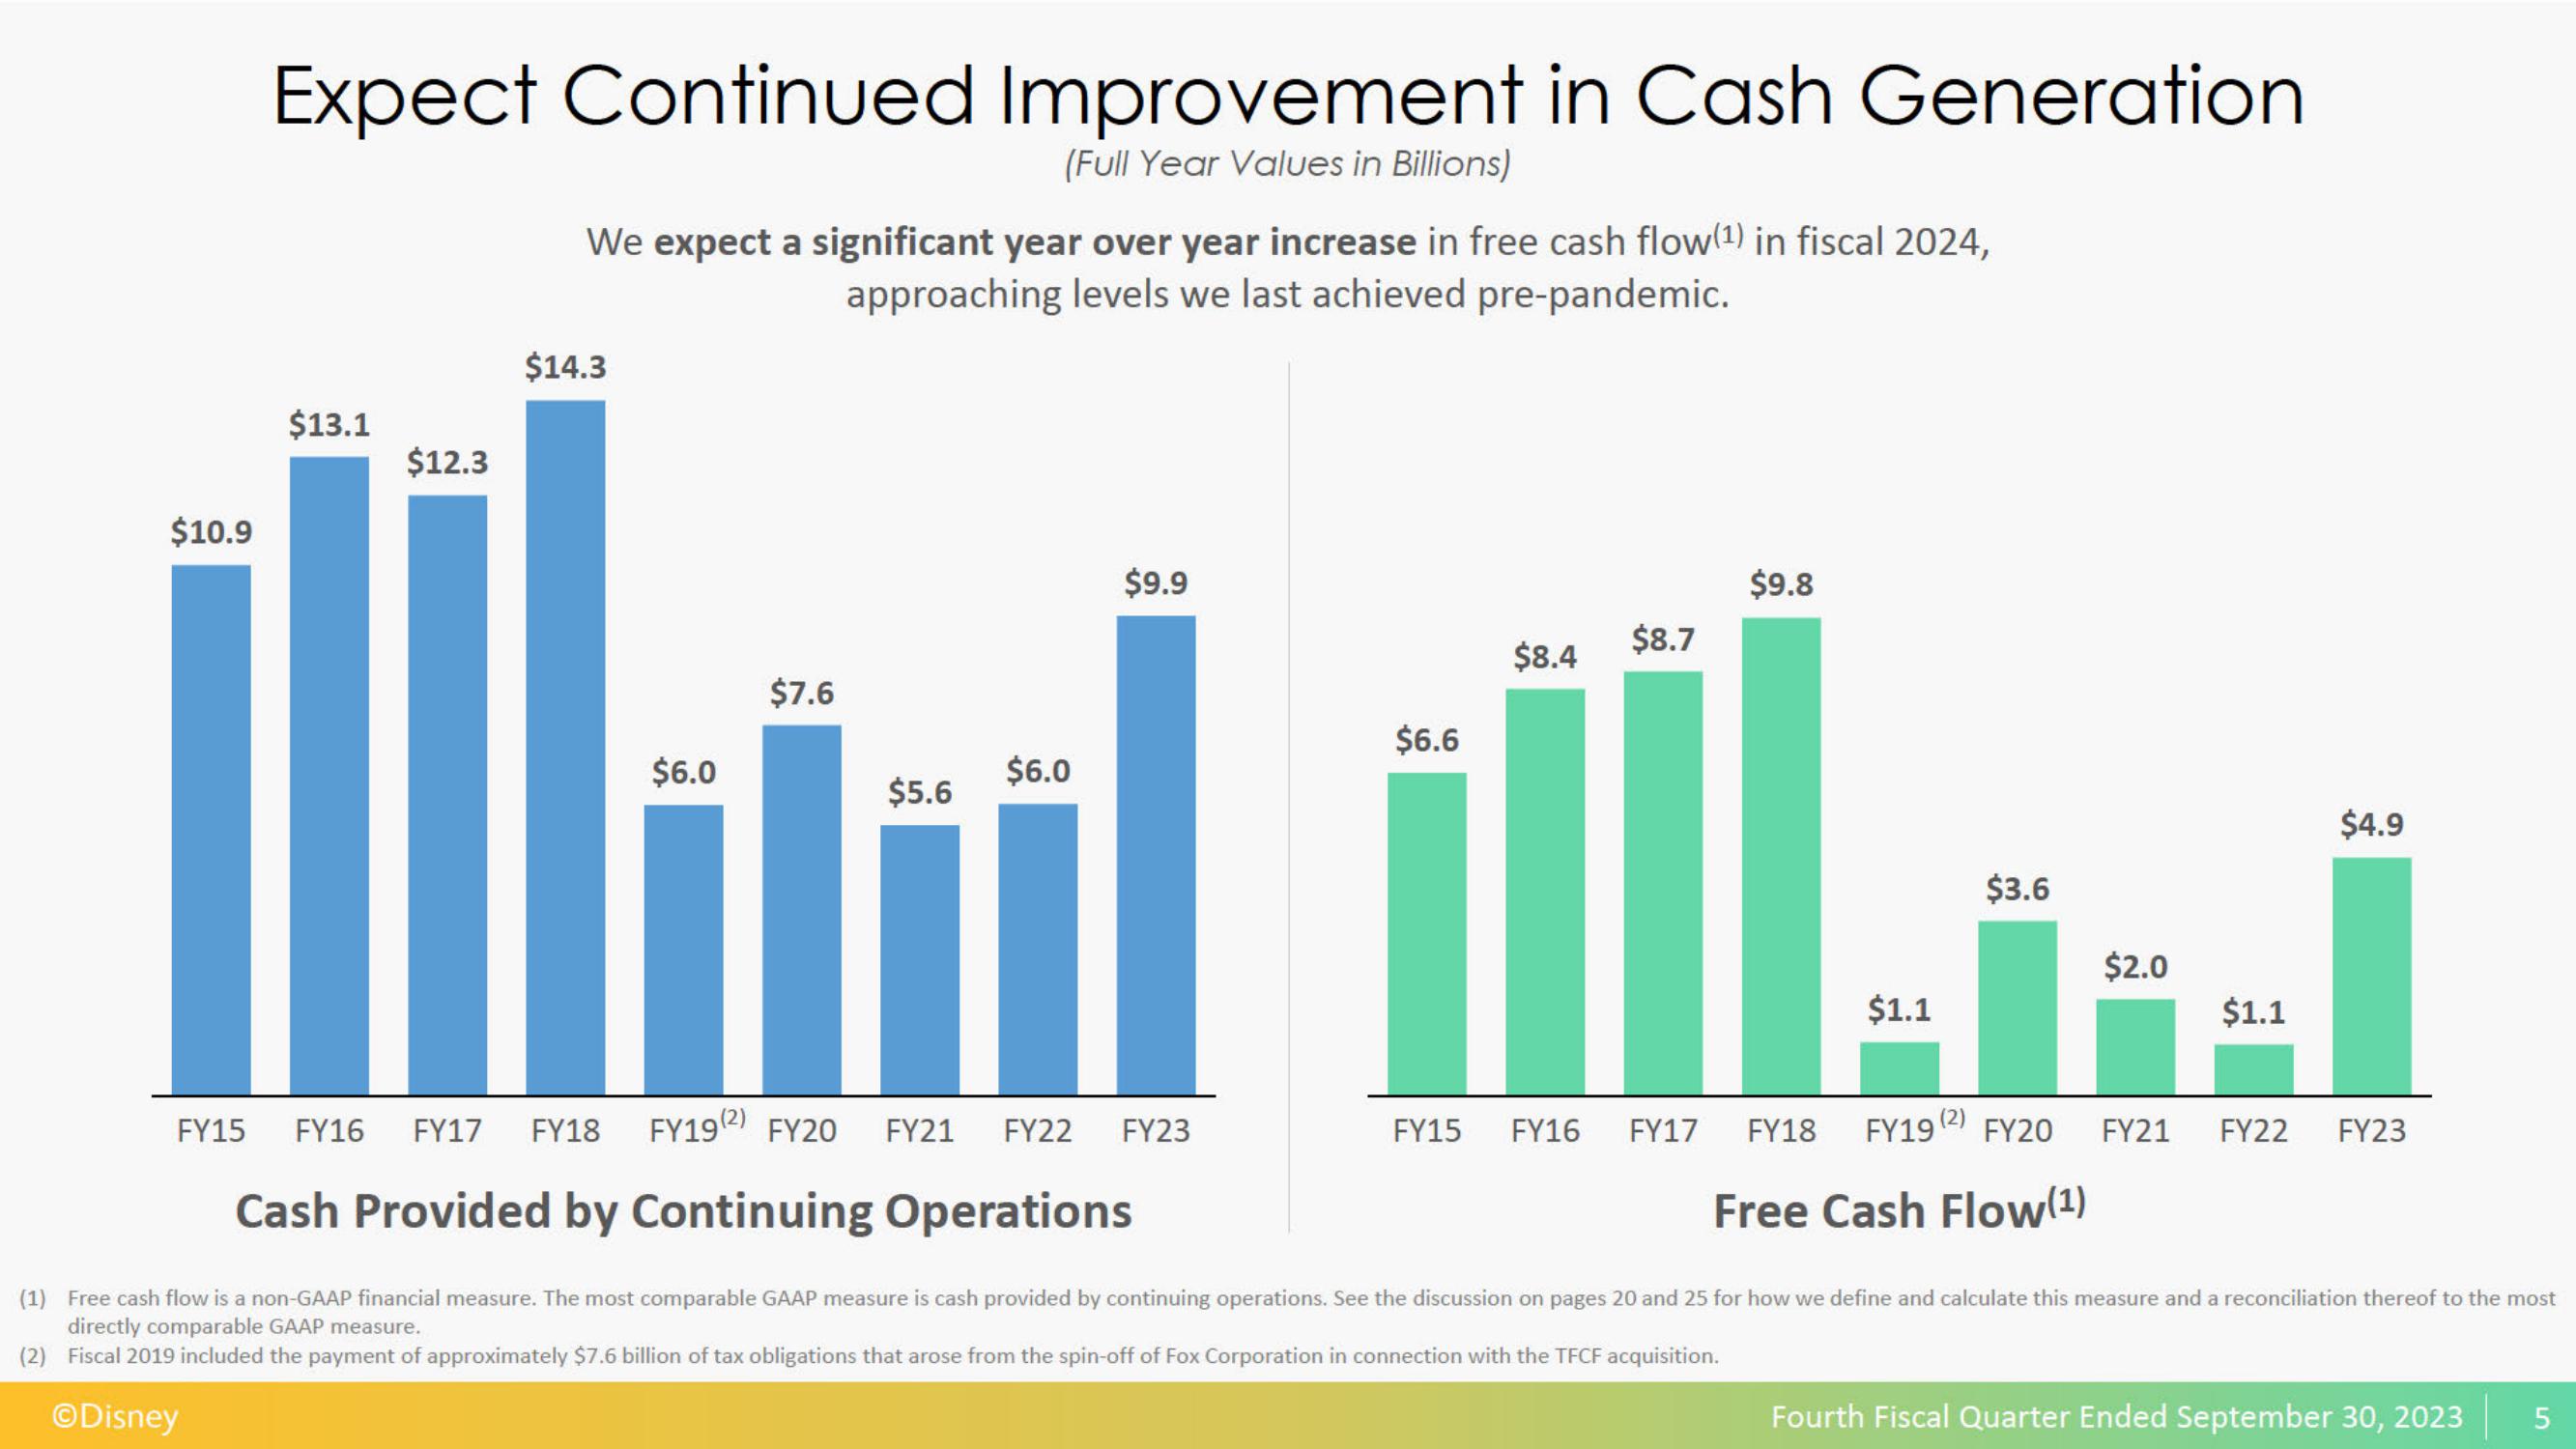
Expect Continued Improvement in Cash Generation
(Full Year Values in Billions)
$13.1
$12.3
We expect a significant year over year increase in free cash flow(1) in fiscal 2024,
approaching levels we last achieved pre-pandemic.
$14.3
$6.0
$7.6
$5.6
$6.0
$9.9
FY19 (2) FY20
FY15 FY16 FY17 FY18
Cash Provided by Continuing Operations
FY21 FY22
FY23
$6.6
$8.4
$8.7
FY15 FY16 FY17
$9.8
$1.1
$3.6
FY18
FY19 (2) FY20
Free Cash Flow(¹)
$2.0
$1.1
$4.9
FY21 FY22 FY23
(1) Free cash flow is a non-GAAP financial measure. The most comparable GAAP measure is cash provided by continuing operations. See the discussion on pages 20 and 25 for how we define and calculate this measure and a reconciliation thereof to the most
directly comparable GAAP measure.
(2)
Fiscal 2019 included the payment of approximately $7.6 billion of tax obligations that arose from the spin-off of Fox Corporation in connection with the TFCF acquisition.
ⒸDisney
Fourth Fiscal Quarter Ended September 30, 2023
5View entire presentation