Affirm Results Presentation Deck
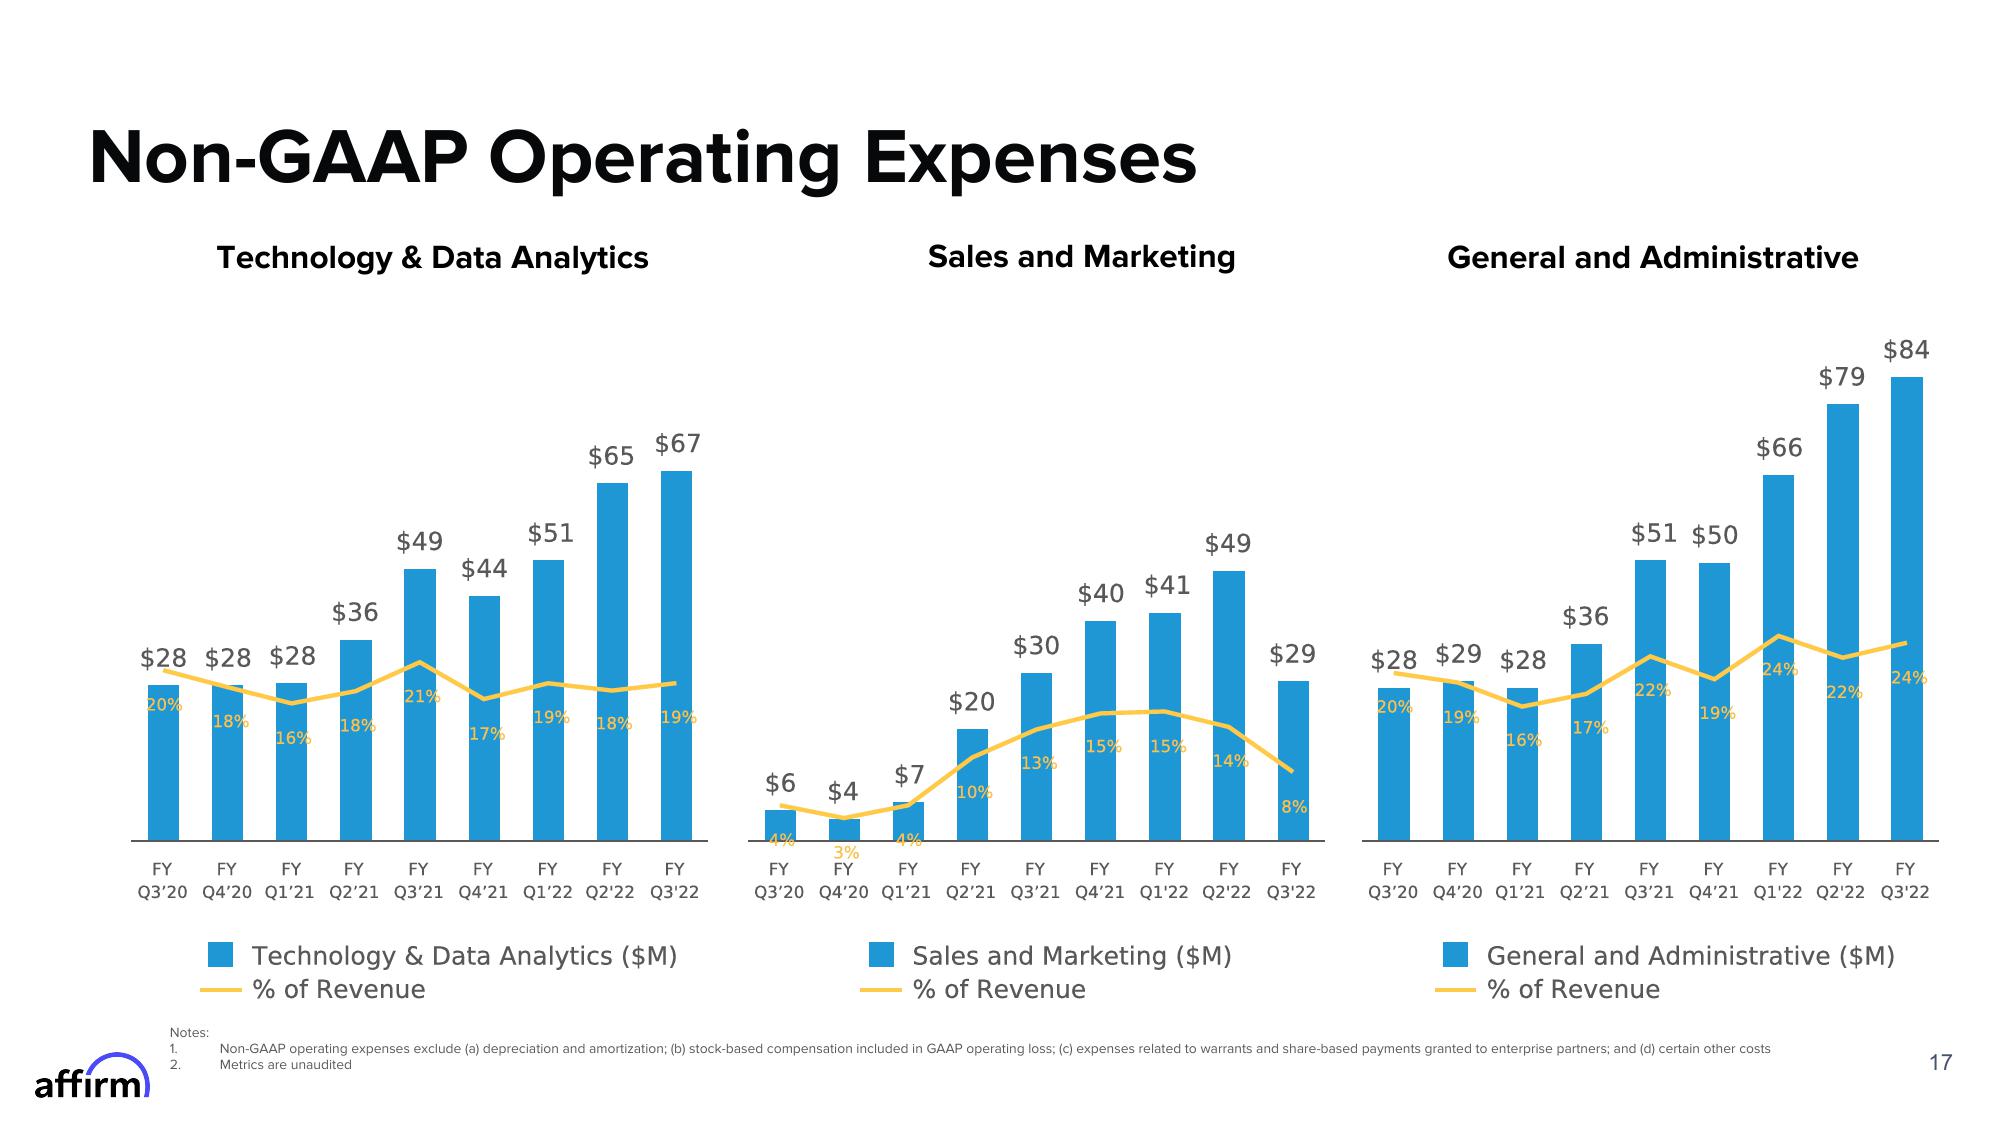
Non-GAAP Operating Expenses
Technology & Data Analytics
Sales and Marketing
$28 $28 $28
20%
affirm
18%
Notes:
1.
2.
16%
$36
18%
$49
21%
$44
17%
$51
$65 $67
FY FY FY FY FY FY FY FY FY
Q3'20 Q4'20 Q1'21 Q2'21 Q3'21 Q4'21 Q1'22 Q2'22 Q3'22
19% 18% 19%
Technology & Data Analytics ($M)
% of Revenue
$7
$20
$30
10%
13%
$40 $41
15% 15%
$49
14%
$6 $4
3%
FY FY FY FY FY FY
FY FY
Q3'20 Q4'20 Q1'21 Q2'21 Q3'21 Q4'21 Q1'22 Q2'22 Q3'22
FY
$29
Sales and Marketing ($M)
% of Revenue
8%
General and Administrative
$28 $29 $28
20%
19%
16%
$36
17%
$51 $50
22%
19%
$66
24%
$79
22%
Non-GAAP operating expenses exclude (a) depreciation and amortization; (b) stock-based compensation included in GAAP operating loss; (c) expenses related to warrants and share-based payments granted to enterprise partners; and (d) certain other costs
Metrics are unaudited
$84
24%
FY
FY
FY
FY FY FY FY FY FY
Q3'20 Q4'20 Q1'21 Q2'21 Q3'21 Q4'21 Q1'22 Q2'22 Q3'22
General and Administrative ($M)
% of Revenue
17View entire presentation