Evercore Investment Banking Pitch Book
SIRE Situation Analysis
Historical and Projected Margin per Ton Analysis
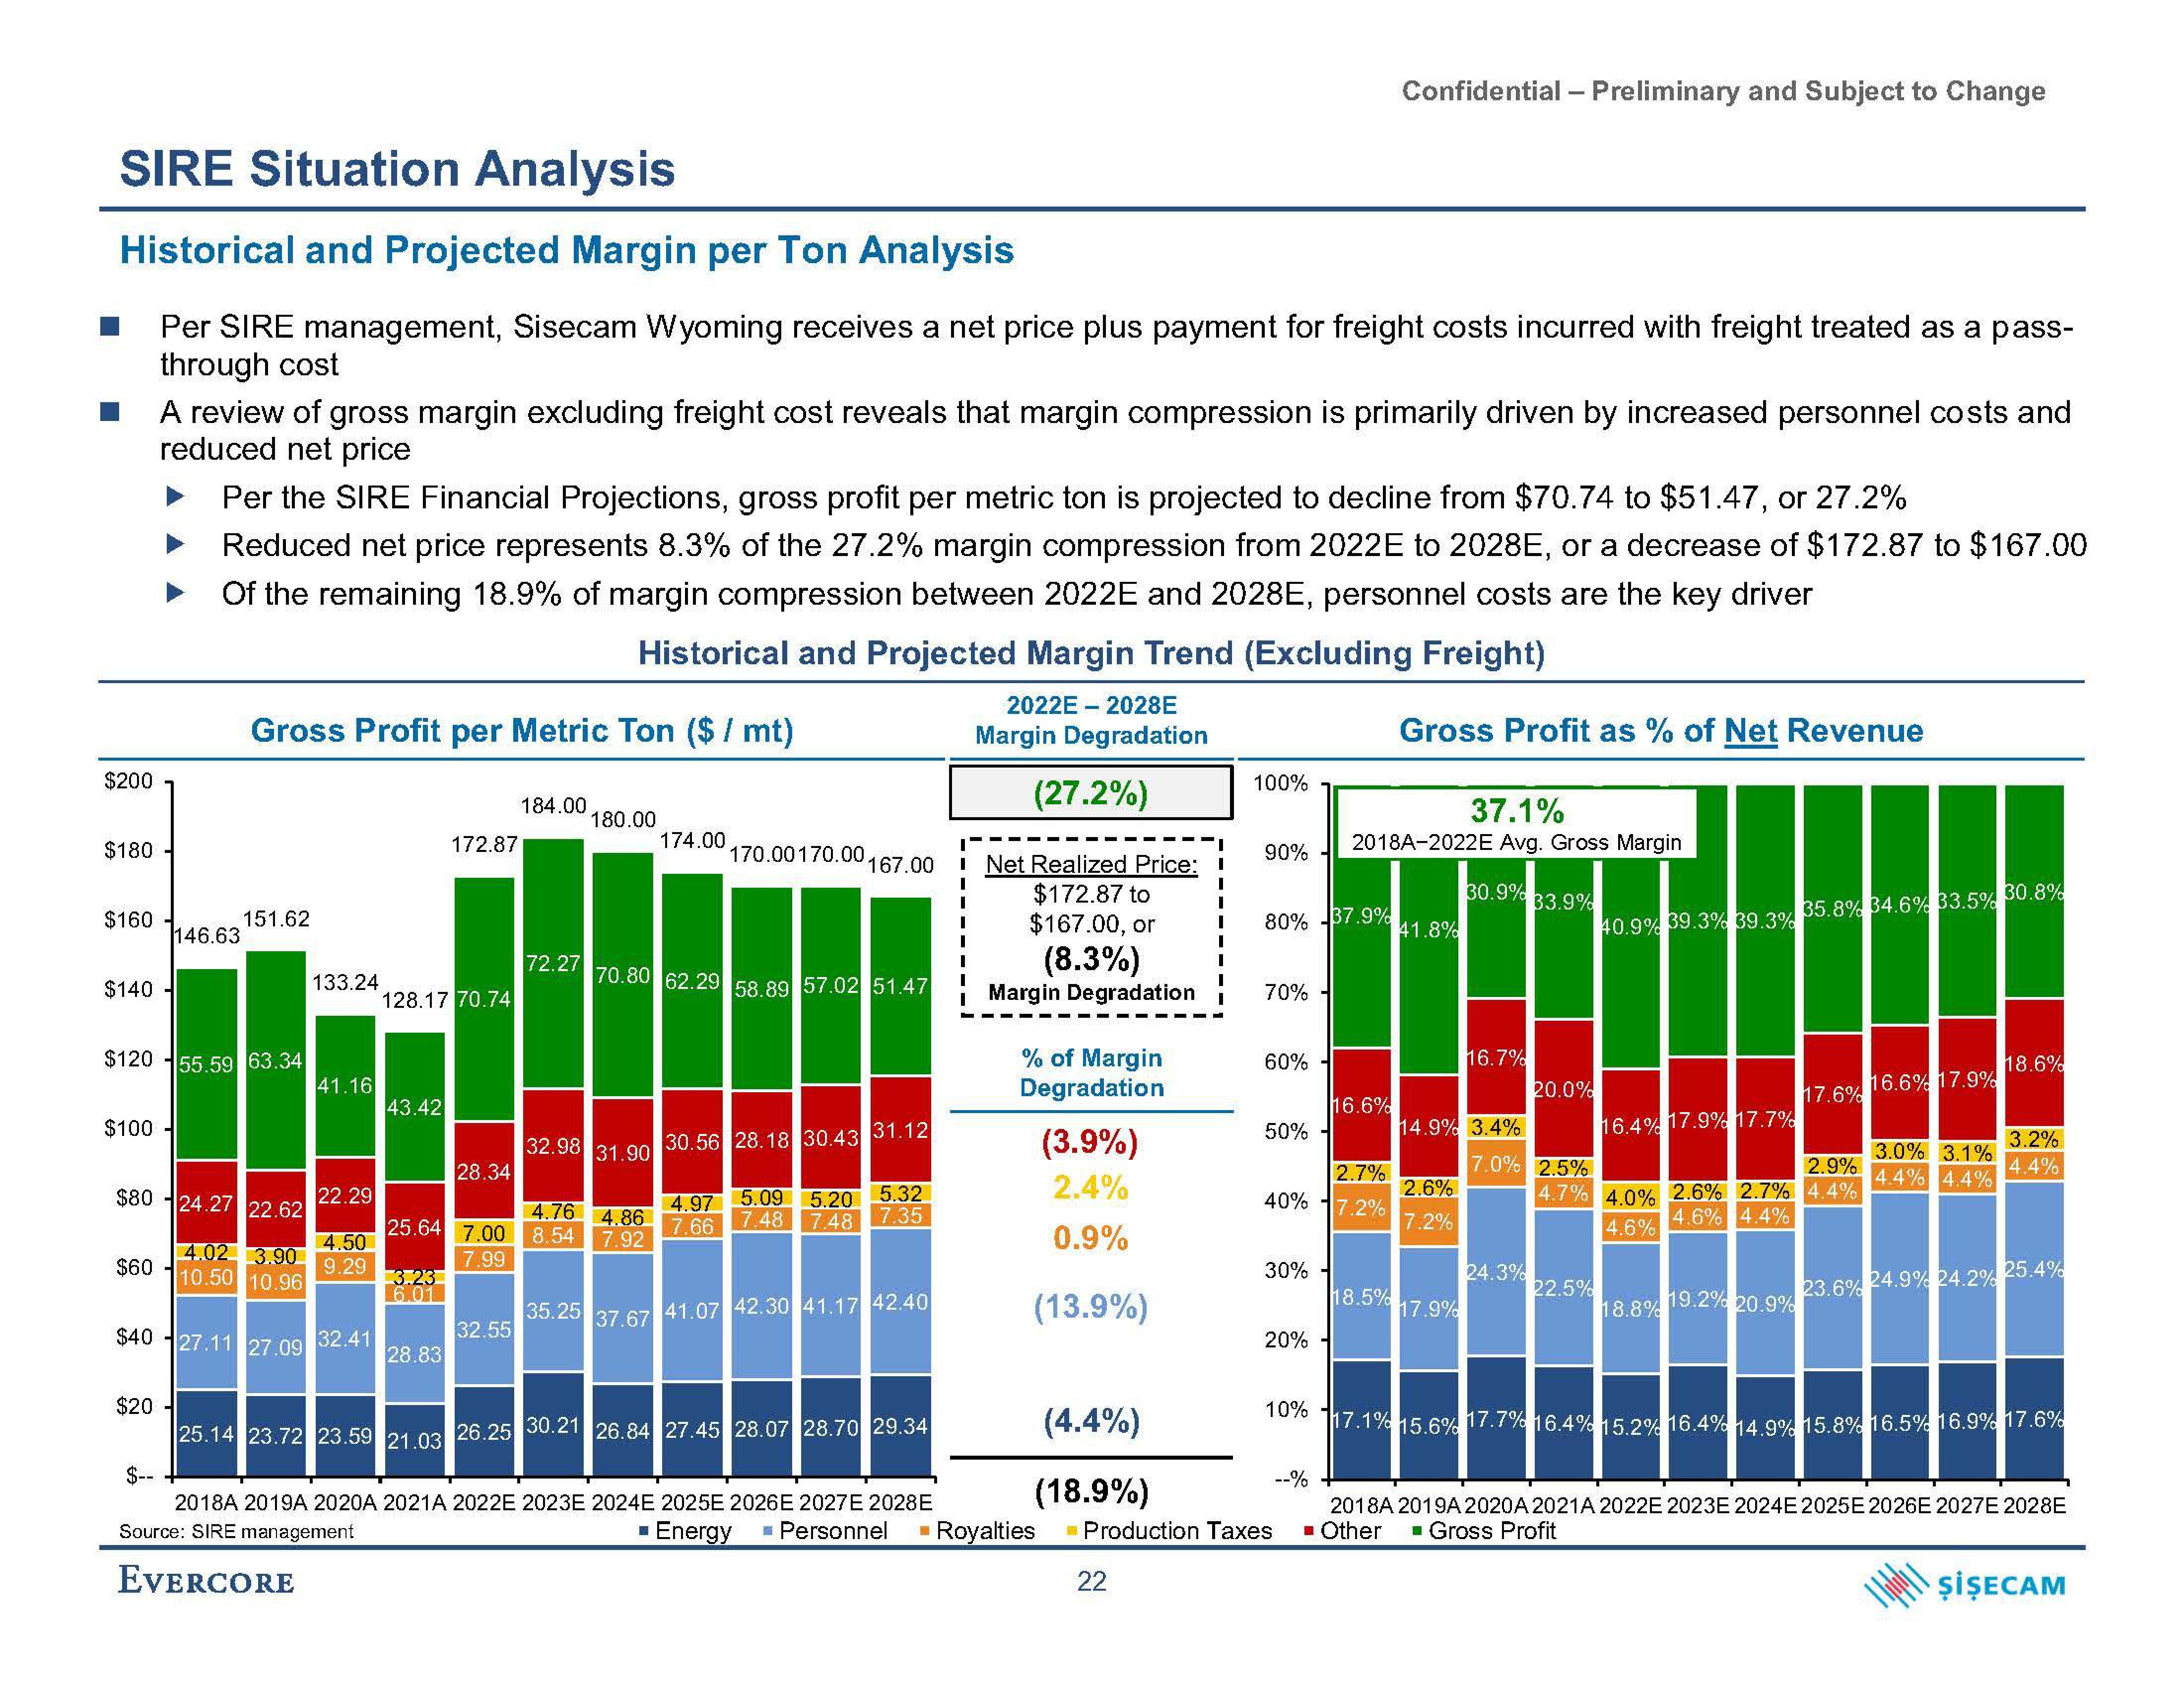
Per SIRE management, Sisecam Wyoming receives a net price plus payment for freight costs incurred with freight treated as a pass-
through cost
$200
$180
$160
$140
$100
$80
A review of gross margin excluding freight cost reveals that margin compression is primarily driven by increased personnel costs and
reduced net price
$60
146.63
$12055.59 63.34
Per the SIRE Financial Projections, gross profit per metric ton is projected to decline from $70.74 to $51.47, or 27.2%
Reduced net price represents 8.3% of the 27.2% margin compression from 2022E to 2028E, or a decrease of $172.87 to $167.00
Of the remaining 18.9% of margin compression between 2022E and 2028E, personnel costs are the key driver
Historical and Projected Margin Trend (Excluding Freight)
2022E-2028E
Margin Degradation
(27.2%)
Gross Profit per Metric Ton ($ / mt)
$20-
151.62
133.24
24.27 22.62
4.02 3.90
10.50 10.96
$40 27.11 27.09 32.41
41.16
22.29
4.50
9.29
128.17 70.74
43.42
25.64
3.23
6.01
28.83
172.87
25.14 23.72 23.59 21.03
28.34
184.00
32.55
72.27
180.00
32.98 31.90
4.76 4.86
7.00 8.54 7.92
7.99
35.25
174.00
70.80 62.29 58.89 57.02 51.47
37.67
170.00 170.00.
167.00
30.56 28.18 30.43 31.12
5.09 5.20 5.32
4.97
7.66
7.48 7.48 7.35
41.07 42.30 41.17 42.40
26.25 30.21 26.84 27.45 28.07 28.70 29.34
2018A 2019A 2020A 2021A 2022E 2023E 2024E 2025E 2026E 2027E 2028E
Source: SIRE management
EVERCORE
I
Net Realized Price: 1
$172.87 to
I
$167.00, or
(8.3%)
Margin Degradation
% of Margin
Degradation
(3.9%)
2.4%
0.9%
(13.9%)
(4.4%)
(18.9%)
▪ Energy ■ Personnel ■ Royalties
100%
22
90%
80% -37.9%
70%-
60% -
50% -
30%
2.7%
40% 17.2%
20%
10%
Production Taxes
Confidential - Preliminary and Subject to Change
--%
37.1%
2018A-2022E Avg. Gross Margin
16.6%
Gross Profit as % of Net Revenue
141.8%
18.5%
2.6%
7.2%
14.9% 3.4%
17.9%
30.9%
17.1% 15.6%
16.7%
33.9%
24.3%
20.0%
40.9% 39.3% 39.3%
22.5%
16.4% 17.9% 17.7%
7.0% 2.5%
4.7% 4.0% 2.6% 2.7% 4.4%
4.6%
4.6% 4.4%
18.8%
35.8% 34.6% 33.5% 30.8%
19.2% 20.9%
17.6% 16.6% 17.9%
3.0% 3.1%
2.9% 4.4% 4.4%
18.6%
3.2%
4.4%
23.6% 24.9% 24.2% 25.4%
17.7% 16.4% 15.2 % 16.4% 14.9% 15.8% 16.5% 16.9% 17.6%
2018A 2019A 2020A 2021A 2022E 2023E 2024E 2025E 2026E 2027E 2028E
■ Other ■ Gross Profit
ŞİŞECAMView entire presentation