Battery Webinar
0.8
0.7
0.6
0.5
0.4
0.3
0.2
0.1
0
60
40
0
0
20-
0
WHAT IS THE POWER CONSUMPTION?
3
How did you validate the power consumption of the a/c?
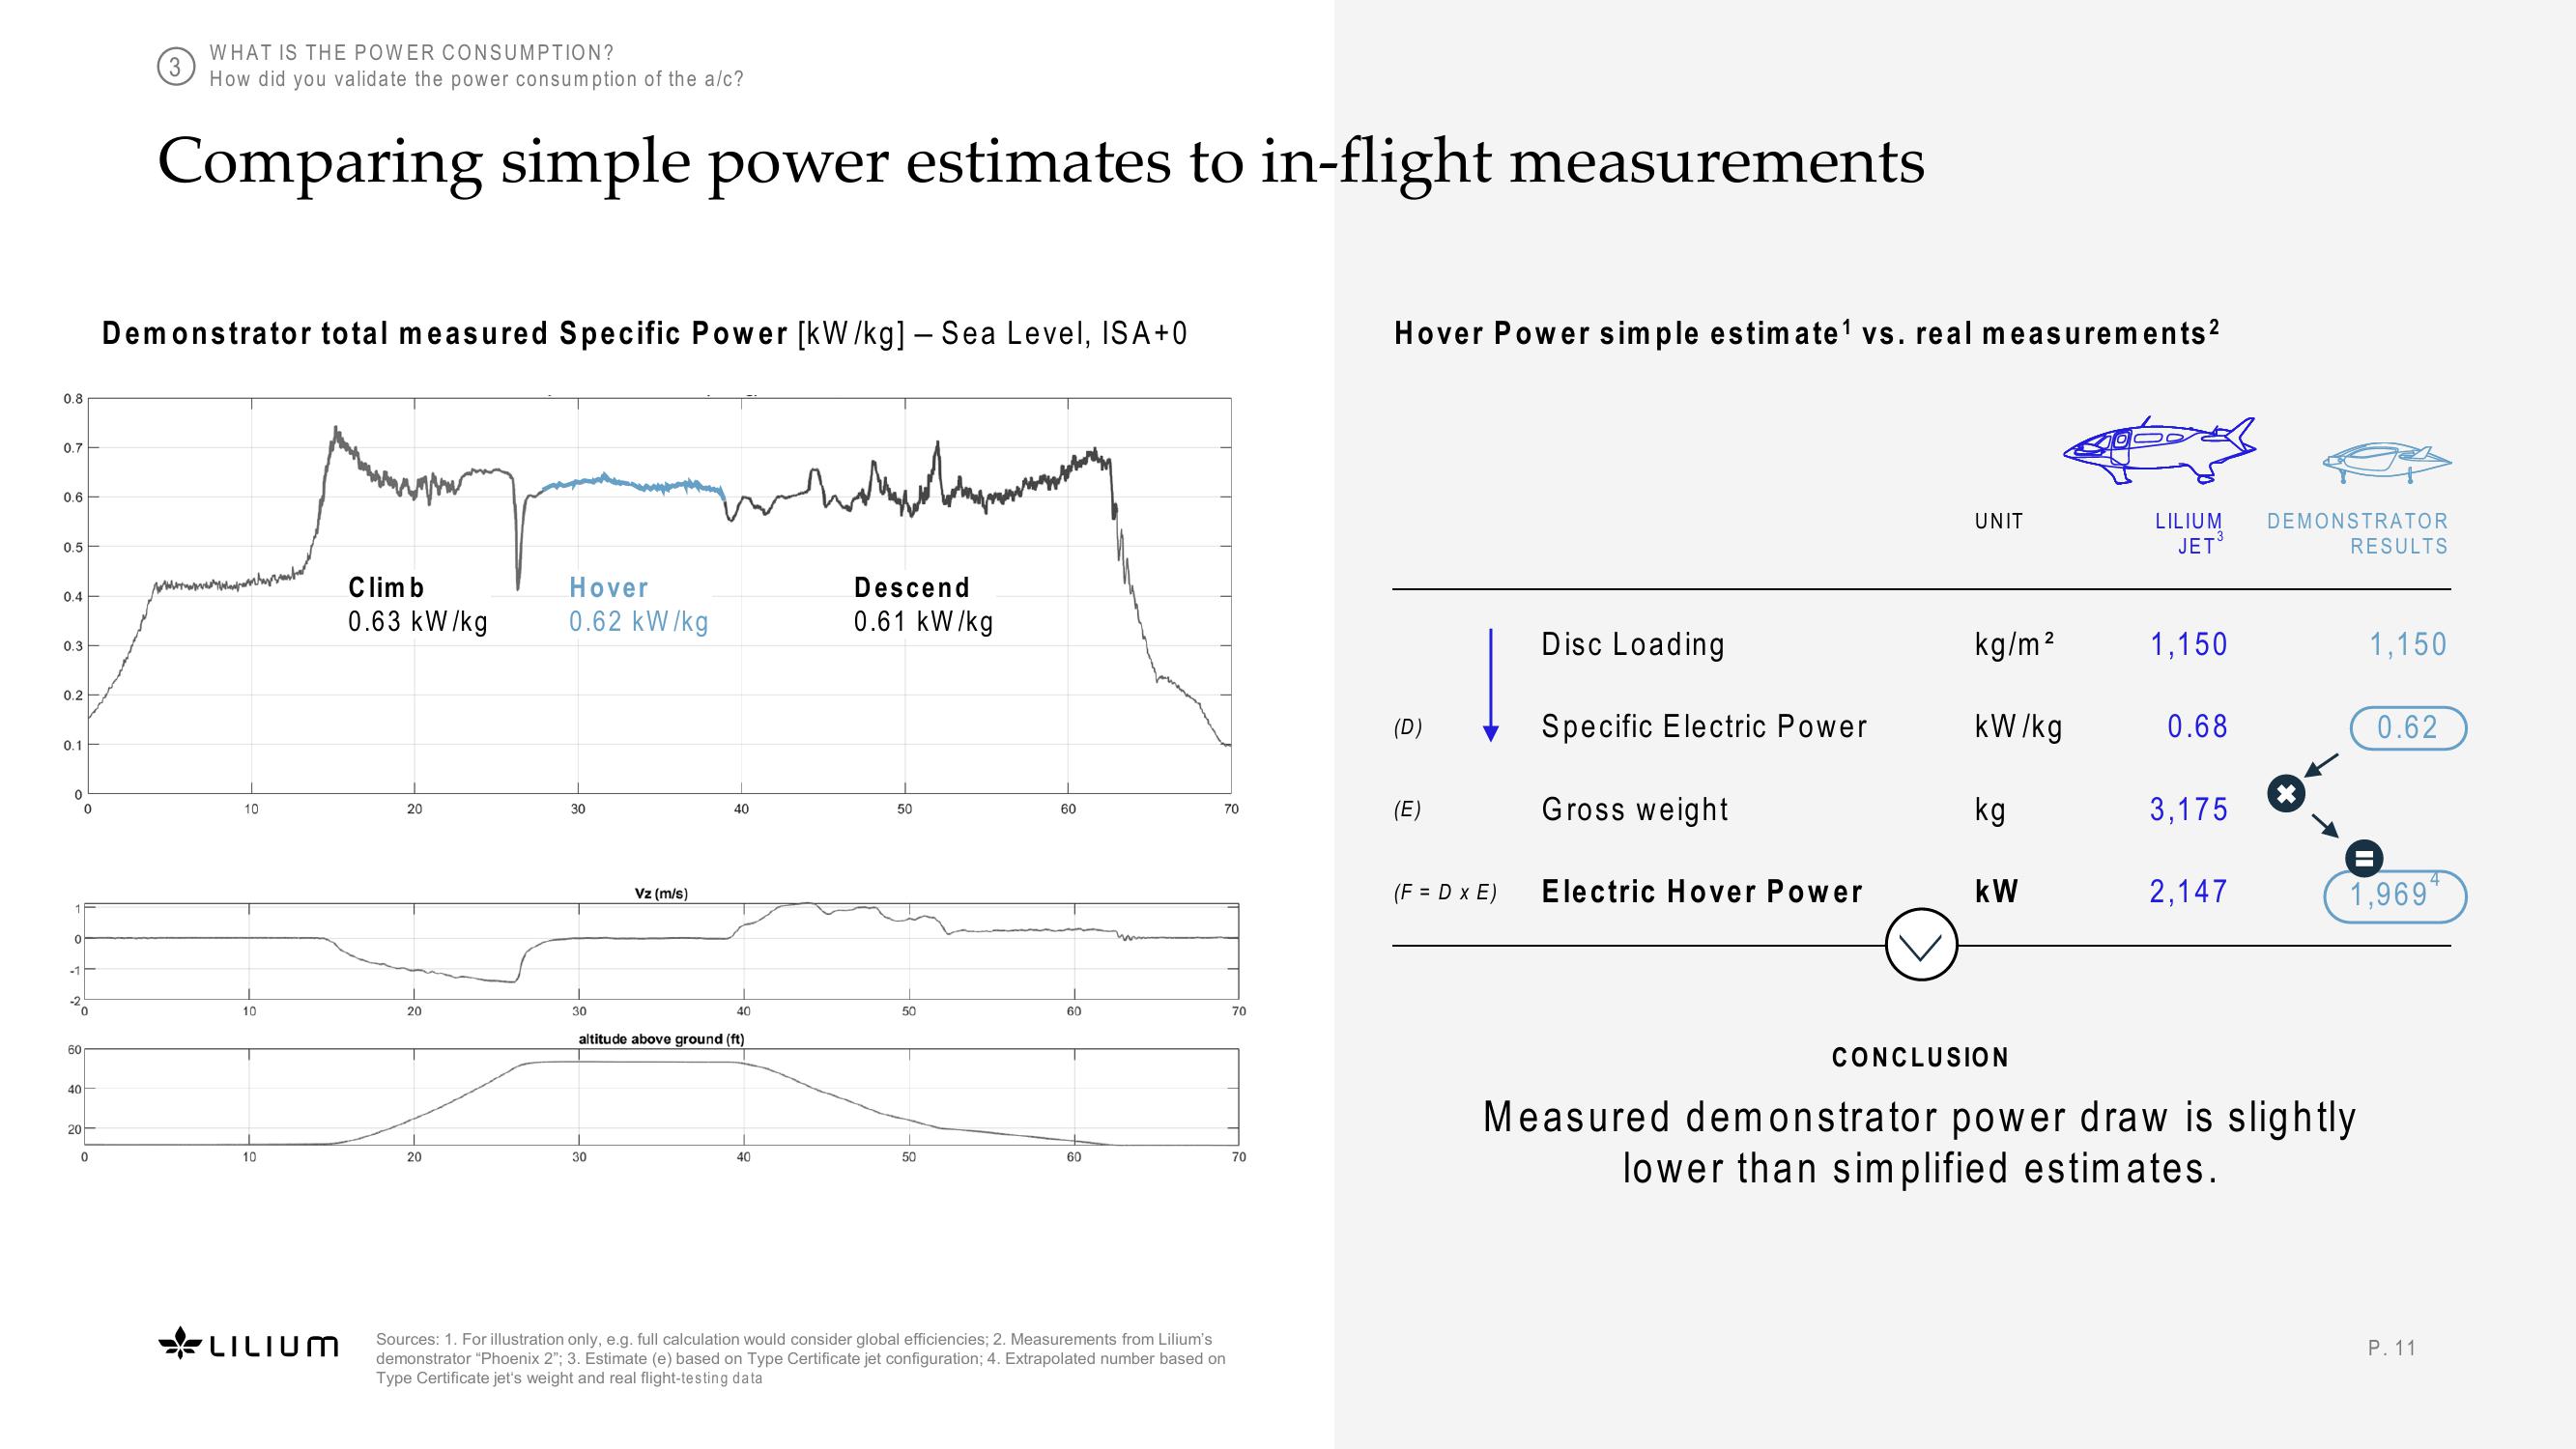
Comparing simple power estimates to in-flight measurements
Demonstrator total measured Specific Power [kW/kg] - Sea Level, ISA+0
10
I
10
10
LILIUM
Climb
0.63 kW/kg
20
20
20
Hover
0.62 kW/kg
30
30
Vz (m/s)
30
40
40
altitude above ground (ft)
40
Descend
0.61 kW/kg
50
50
50
60
60
60
70
Sources: 1. For illustration only, e.g. full calculation would consider global efficiencies; 2. Measurements from Lilium's
demonstrator "Phoenix 2"; 3. Estimate (e) based on Type Certificate jet configuration; 4. Extrapolated number based on
Type Certificate jet's weight and real flight-testing data
70
70
Hover Power simple estimate¹ vs. real measurements²
(D)
(E)
(F = D x E)
Disc Loading
Specific Electric Power
Gross weight
Electric Hover Power
UNIT
kg/m²
kW/kg
kg
kW
CONCLUSION
LILIUM
JET
1,150
0.68
3,175
2,147
DEMONSTRATOR
RESULTS
1,150
Measured demonstrator power draw is slightly
lower than simplified estimates.
0.62
1,9694
P. 11View entire presentation