Skillz SPAC Presentation Deck
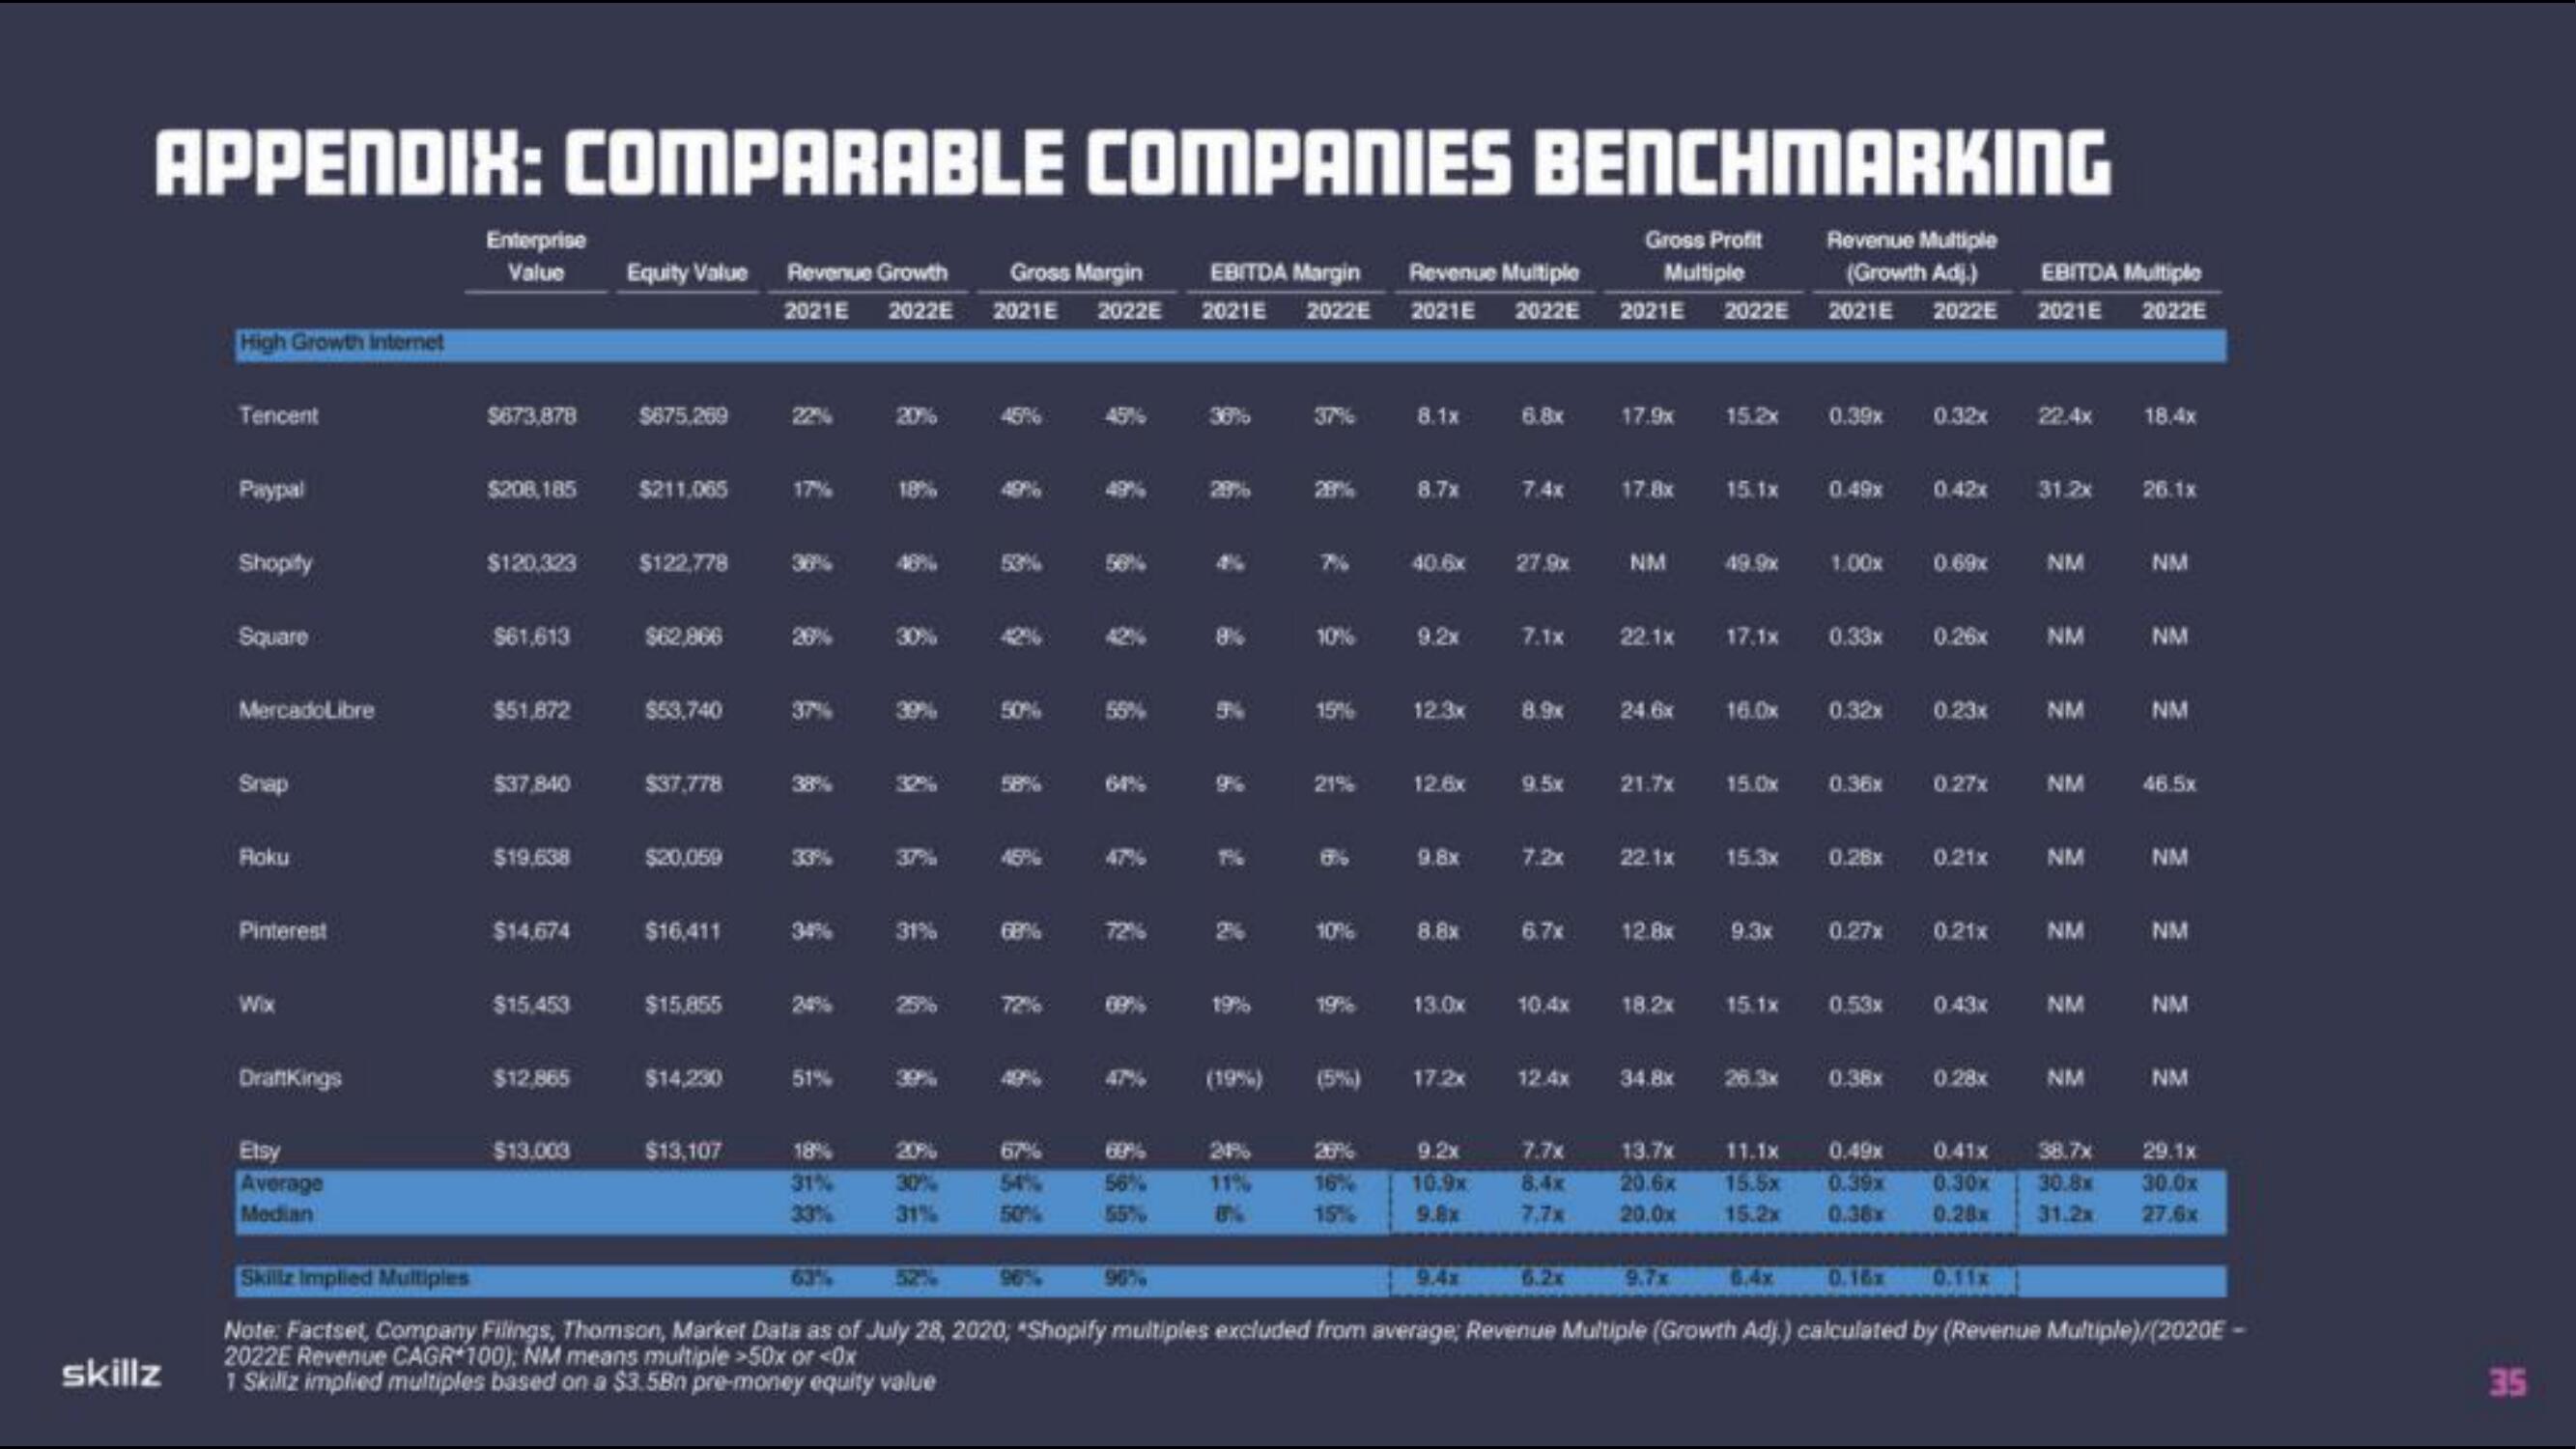
APPENDIX: COMPARABLE COMPANIES BENCHMARKING
Gross Profit Revenue Multiple
Multiple
(Growth Adj.) EBITDA Multiple
2021E 2022E 2021E 2022E 2021E 2022E
skillz
High Growth Internet
Tencent
Paypal
Shopify
Square
MercadoLibre
Snap
Roku
Pinterest
Wix
DraftKings
Etsy
Average
Median
Enterprise
Value
$673,878
$120,323
$208,185 $211.065
$61,613
$51,872
$37,840
$19.638
$14,674
$15,453
$12,865
Equity Value Revenue Growth Gross Margin EBITDA Margin Revenue Multiple
2021 2022 2021 2022 2021 2022E 2021E 2022E
$13,003
$675,269
$122,778
$62,866
$53,740
$37,778
$20,059
$16,411
$15,855
$14,230
$13,107
22%
37%
38%
24%
51%
18%
31%
20%
18%
30%
31%
20%
30%
31%
50%
68%
55%
64%
Č
69%
55%
36%
28%
8%
8
8
(19%)
24%
11%
37%
28%
10%
15%
21%
10%
$
8.1x 6.8x
26%
16%
15%
8.7%
40.6x
9.2x
12.3x
12.6x
9.8x
8.8x
13.0x
METEN
(5%) 17.2x
9.2x
10.9x
9.8x
7.4x
9.4x
27.9x
7.1x
8.9x
9.5x
7.2x
6.7x
17.9x 15.2x 0.39x 0.32x
12.4x
17.8x
NM
22.1x
24.6x
21.7x
22.1x
12.8x
15.1x
49.9x
16.0x
17.1x 0.33x
15.0x
15.3x
9.3x
10.4x 18.2x 15.1x
0.49x 0.42x
34.8x 26.3x
1.00x
0.36x
0.32x 0.23x
0.27x
0.53x
0.69x
0.28x 0.21x
0.38x
0.26x
0.49x
7.7x
8.4x
7.7x 20.0x 15.2x 0.38x
13.7x 11.1x
20.6x 15.5x 0.39x
0.27x
0.21x
0.43x
0.28x
22.4x 18.4x
31.2x 26.1x
NM
NM
NM
NM
NM
NM
NM
NM
NM
NM
NM
46.5x
NM
NM
NM
NM
0.41x 38.7x 29.1x
0.30x 30.8x 30.0x
0.28x 31.2x 27.6x
Skillz Implied Multiples
63%
0.16x 0.11x
Note: Factset, Company Filings, Thomson, Market Data as of July 28, 2020; "Shopify multiples excluded from average: Revenue Multiple (Growth Adj) calculated by (Revenue Multiple)/(2020E -
2022E Revenue CAGR 100), NM means multiple >50x or <0x
1 Skillz implied multiples based on a $3.5Bn pre-money equity value
35View entire presentation