Lanvin Results Presentation Deck
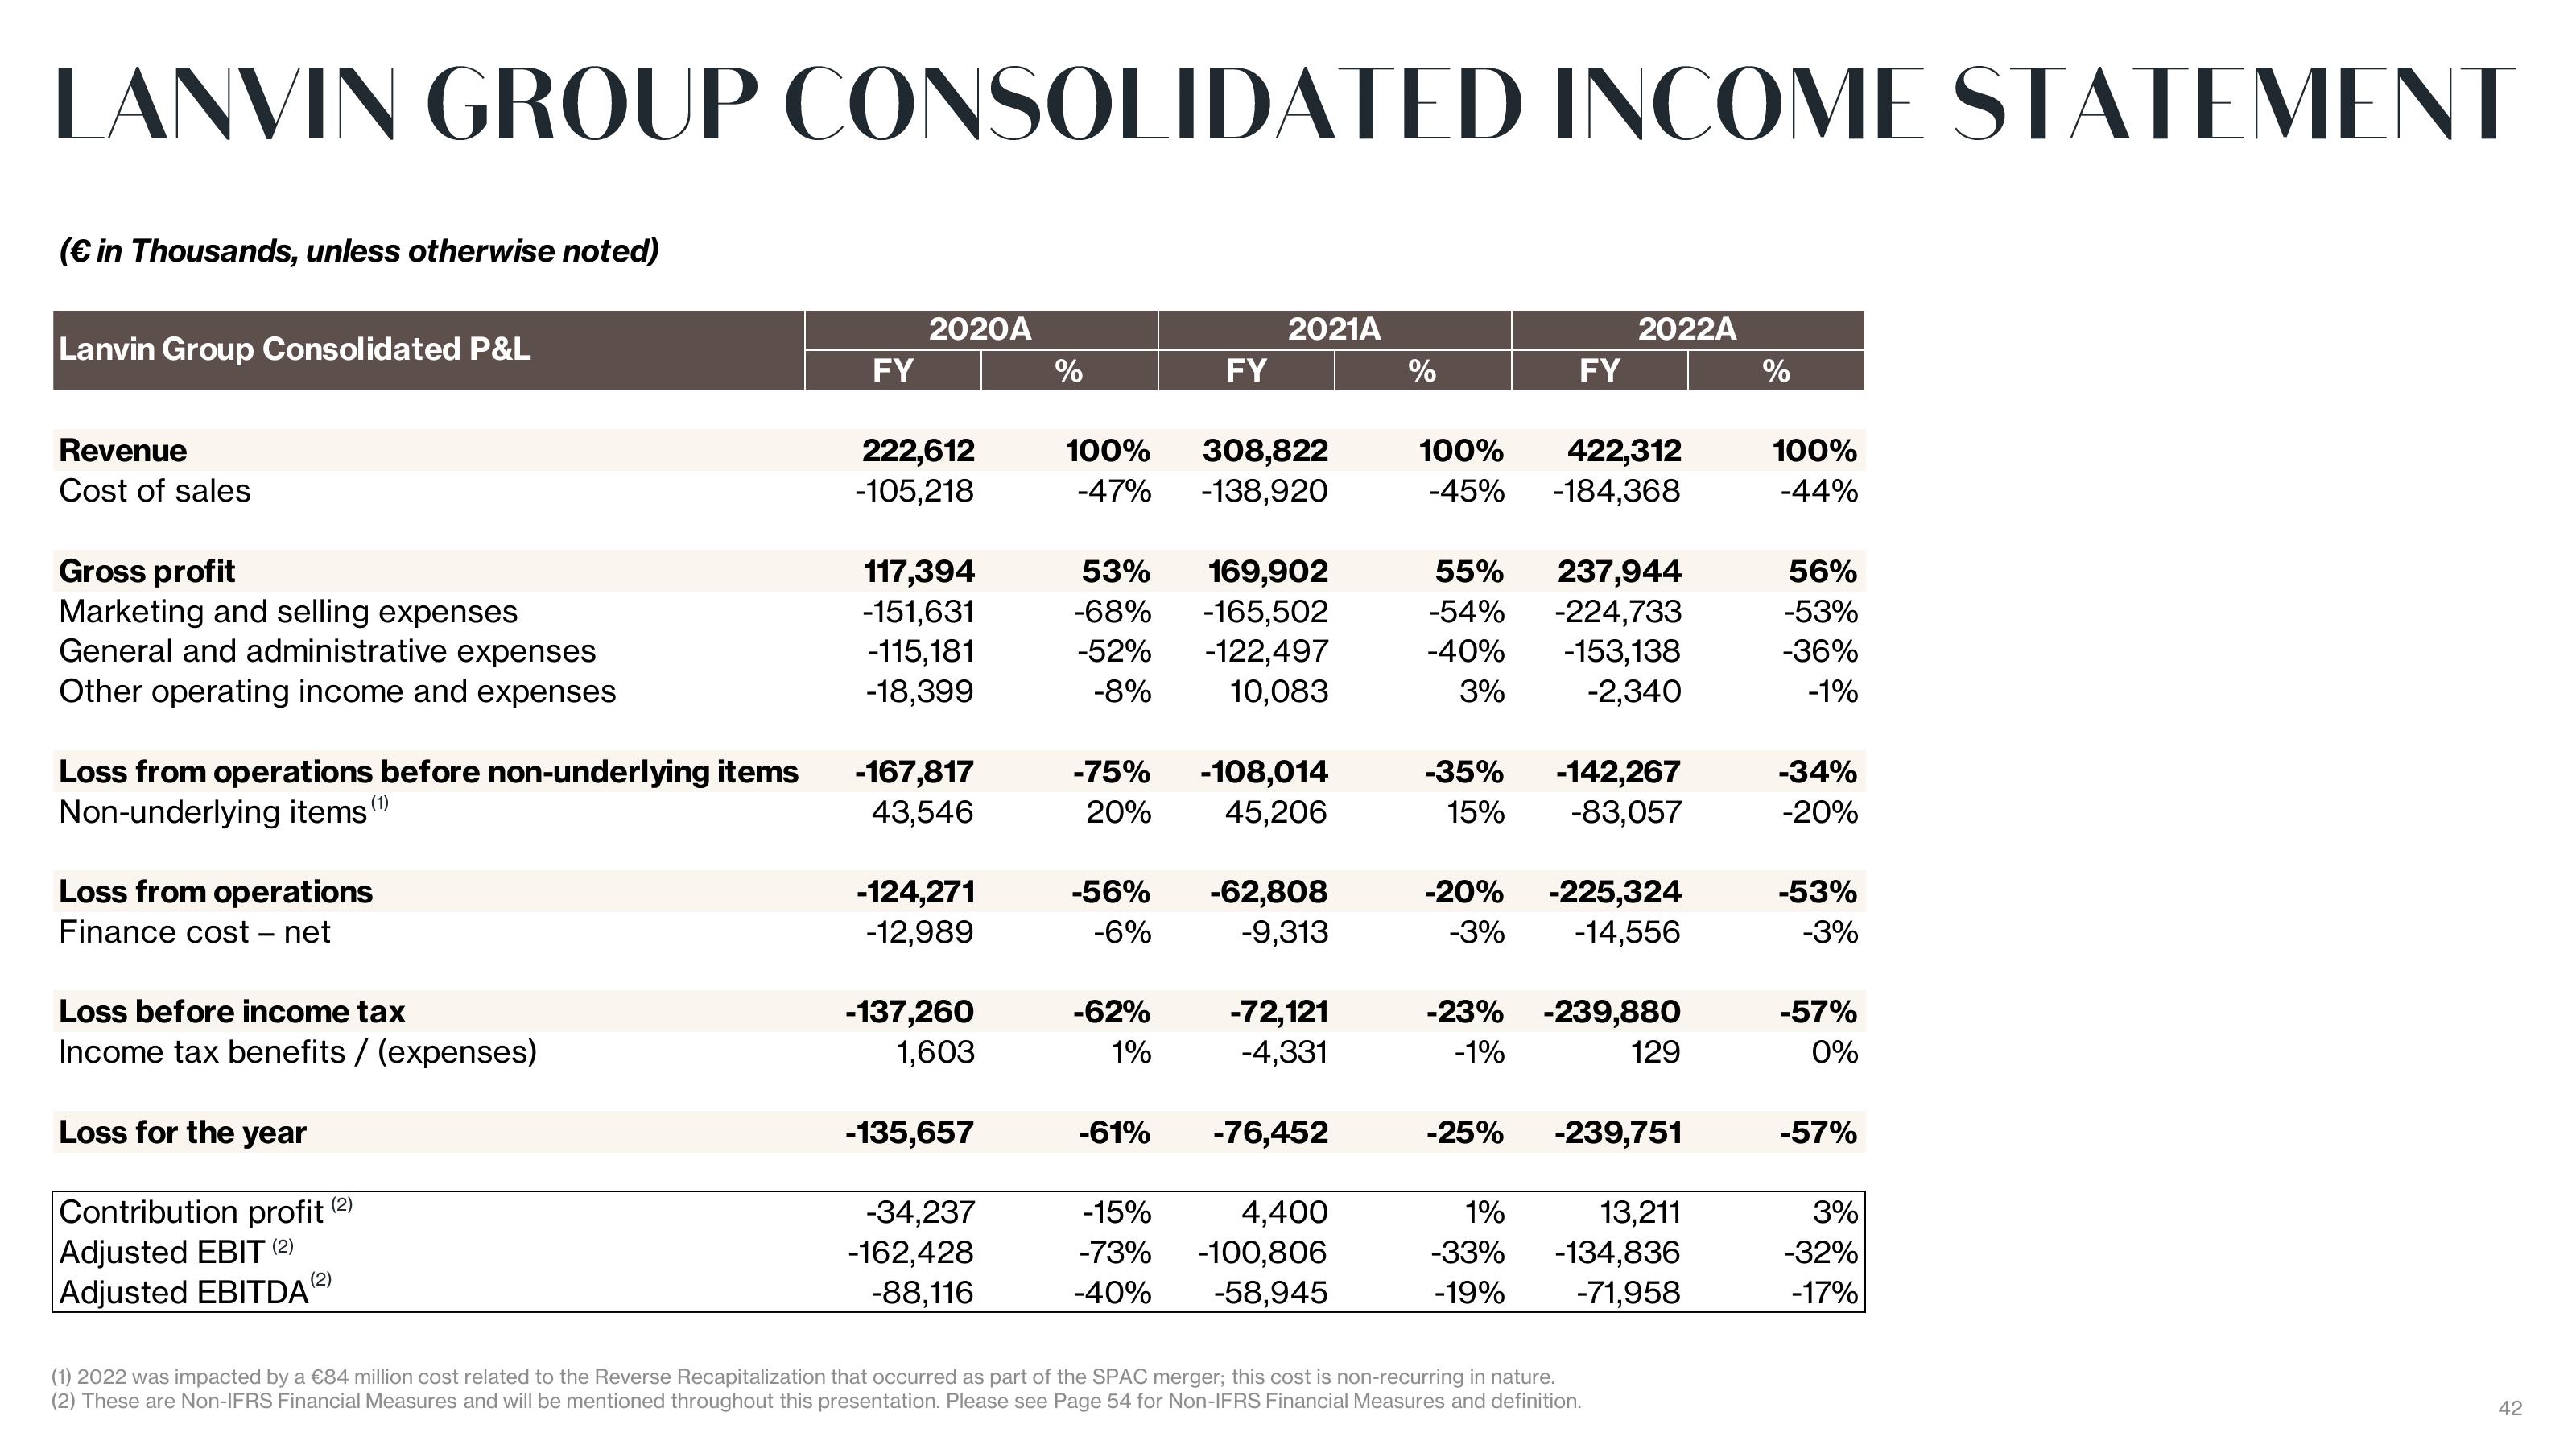
LANVIN GROUP CONSOLIDATED INCOME STATEMENT
(€ in Thousands, unless otherwise noted)
Lanvin Group Consolidated P&L
Revenue
Cost of sales
Gross profit
Marketing and selling expenses
General and administrative expenses
Other operating income and expenses
Loss from operations before non-underlying items
Non-underlying items (¹)
Loss from operations
Finance cost - net
Loss before income tax
Income tax benefits/(expenses)
Loss for the year
Contribution profit (2)
Adjusted EBIT (2)
Adjusted EBITDA
FY
2020A
222,612
-105,218
117,394
-151,631
-115,181
-18,399
-167,817
43,546
-124,271
-12,989
-137,260
1,603
-135,657
-34,237
-162,428
-88,116
%
100%
-47%
-75%
20%
-56%
-6%
53% 169,902
-68% -165,502
-52% -122,497
-8% 10,083
-62%
1%
FY
-61%
2021A
308,822
-138,920
-108,014
45,206
-62,808
-9,313
-72,121
-4,331
-76,452
-15%
4,400
-73% -100,806
-58,945
-40%
%
FY
100% 422,312
-45% -184,368
-35%
15%
55% 237,944
-54% -224,733
-40% -153,138
3% -2,340
2022A
-25%
-142,267
-83,057
-20% -225,324
-3% -14,556
-23% -239,880
-1%
129
-239,751
13,211
1%
-33% -134,836
-19%
-71,958
(1) 2022 was impacted by a €84 million cost related to the Reverse Recapitalization that occurred as part of the SPAC merger; this cost is non-recurring in nature.
(2) These are Non-IFRS Financial Measures and will be mentioned throughout this presentation. Please see Page 54 for Non-IFRS Financial Measures and definition.
%
100%
-44%
56%
-53%
-36%
-1%
-34%
-20%
-53%
-3%
-57%
0%
-57%
3%
-32%
-17%
42View entire presentation