LVMH Results Presentation Deck slide image

LVMH Results Presentation Deck

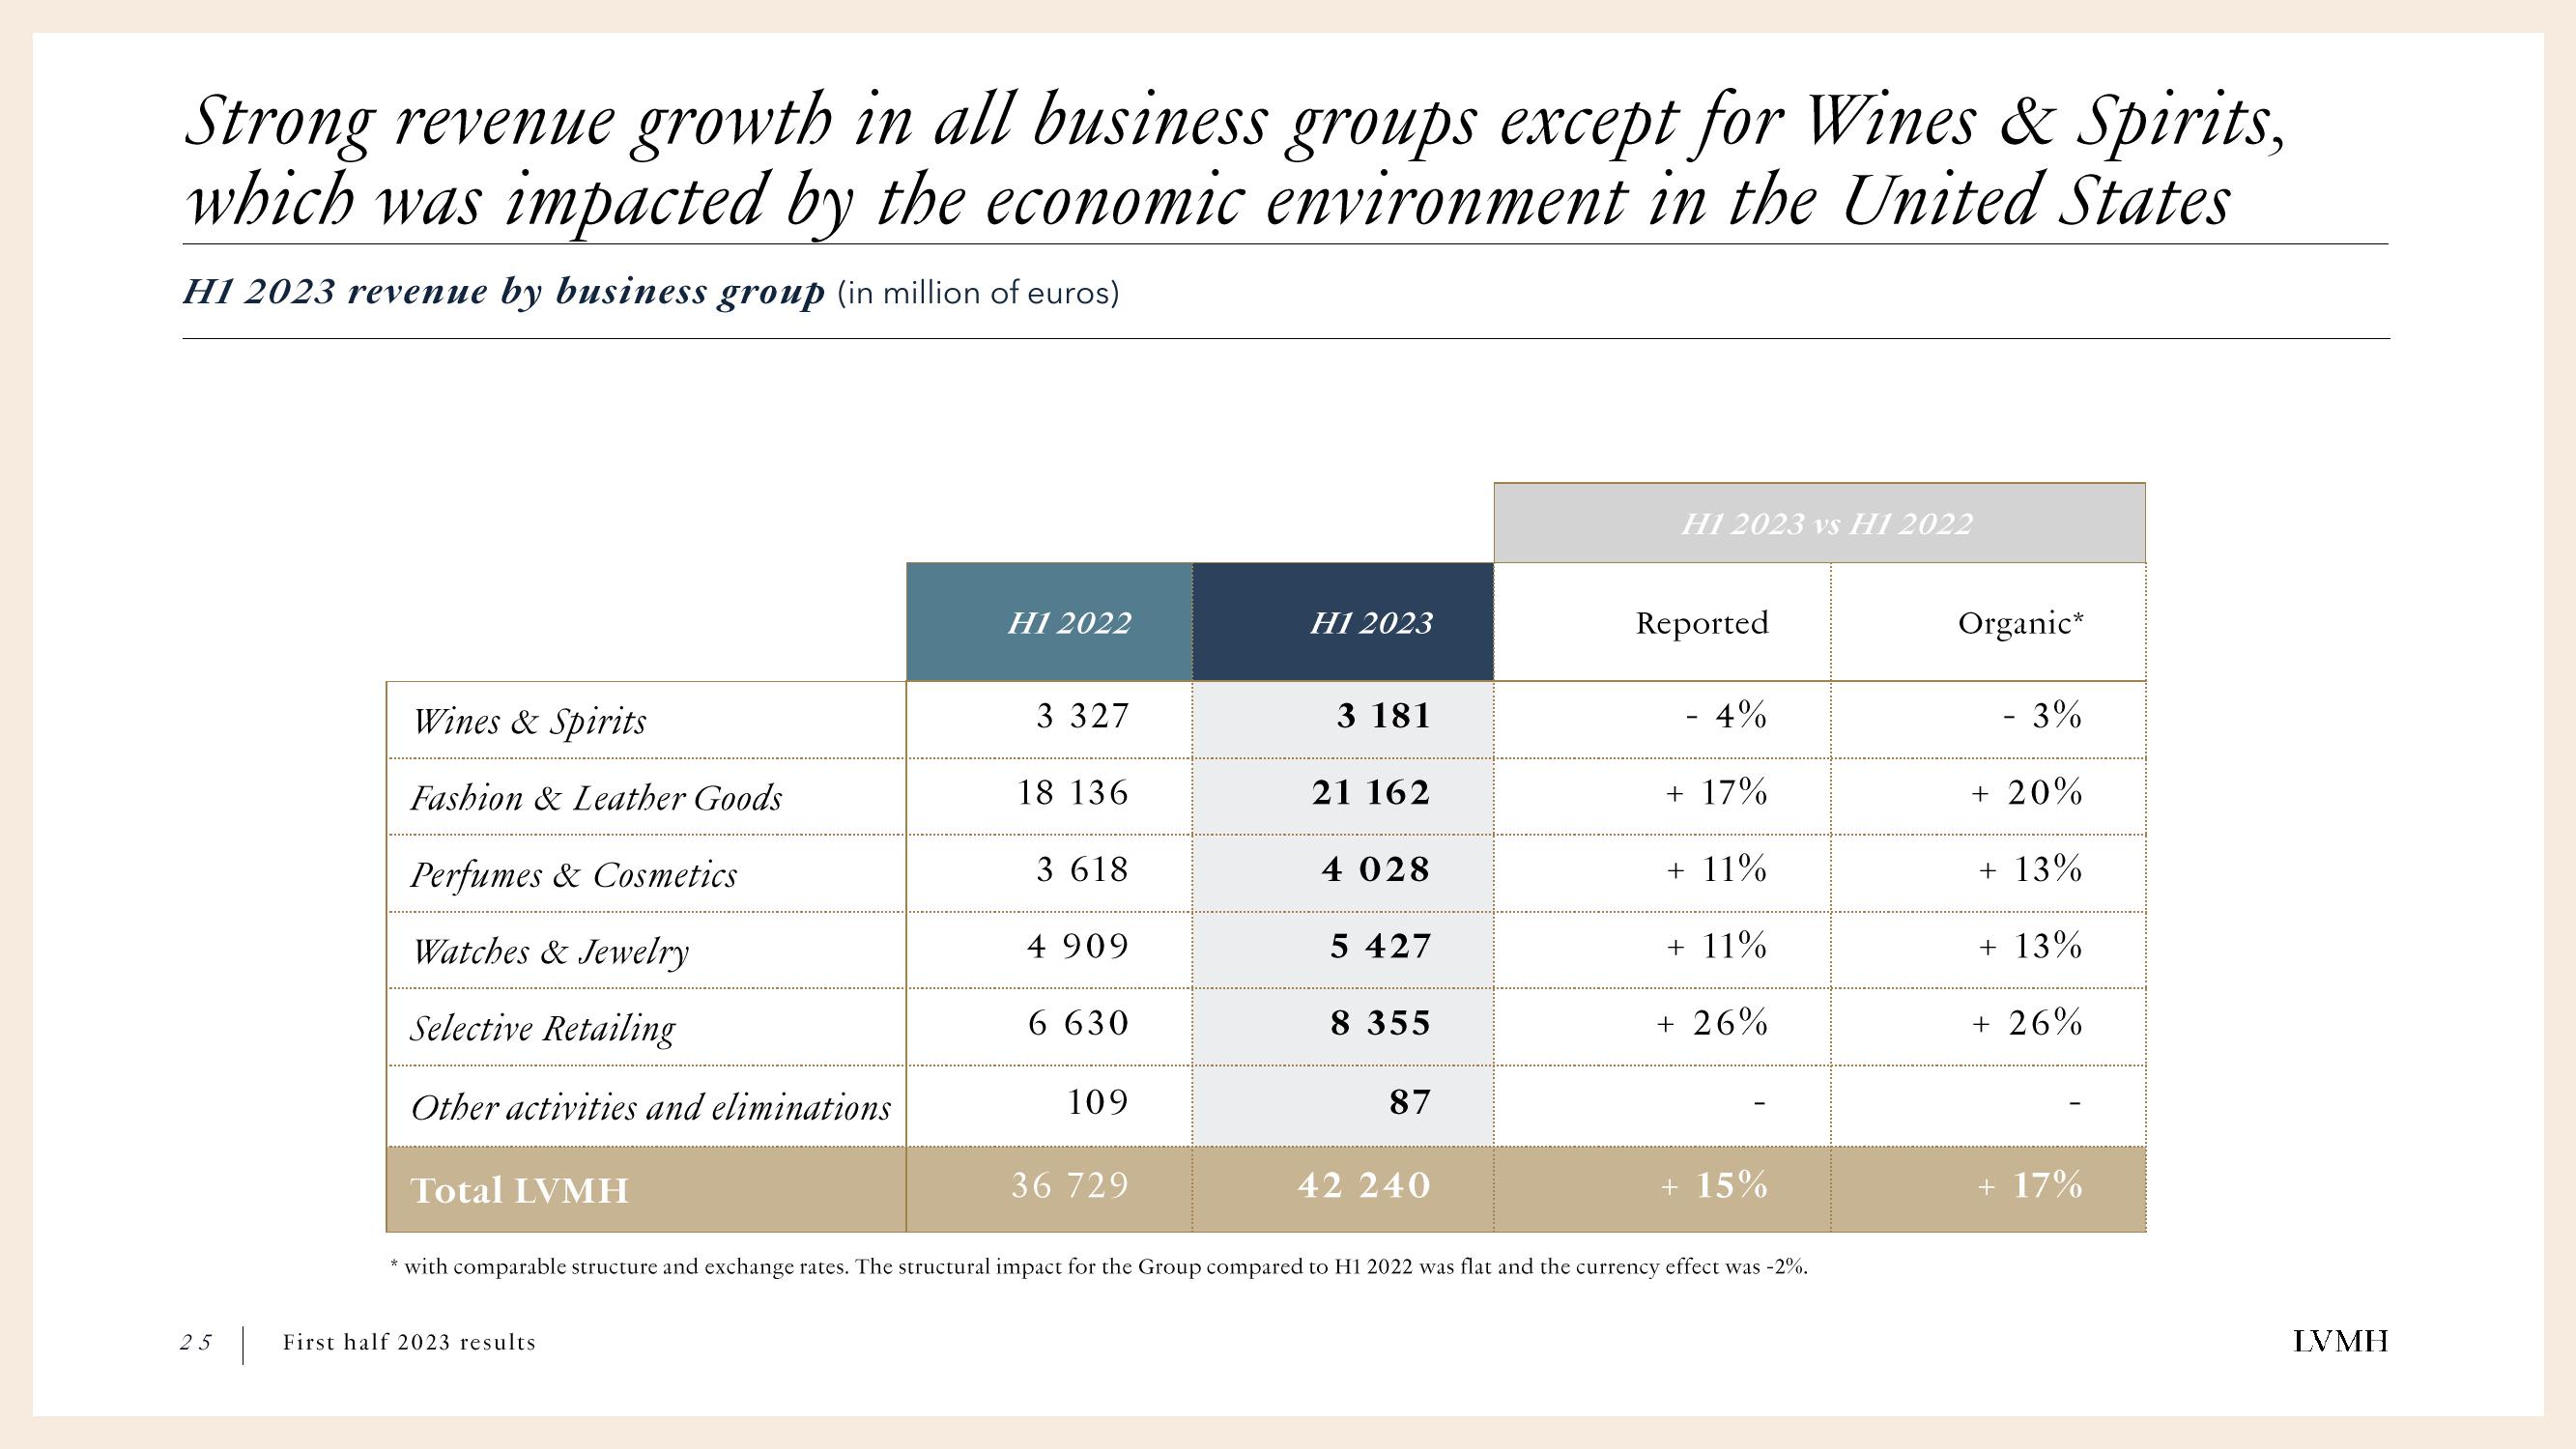
Strong revenue growth in all business groups except for Wines & Spirits, which was impacted by the economic environment in the United States H1 2023 revenue by business group (in million of euros) Wines & Spirits Fashion & Leather Goods Perfumes & Cosmetics Watches & Jewelry Selective Retailing Other activities and eliminations Total LVMH H1 2022 25 First half 2023 results 3 327 18 136 3 618 4 909 6 630 109 36 729 H1 2023 3 181 21 162 4 028 5 427 8 355 87 42 240 H1 2023 vs H1 2022 Reported 4% + 17% + 11% + 11% + 26% + 15% * with comparable structure and exchange rates. The structural impact for the Group compared to H1 2022 was flat and the currency effect was -2%. Organic* - 3% + 20% + 13% + 13% + 26% + 17% LVMH
View entire presentation