Paysafe Results Presentation Deck
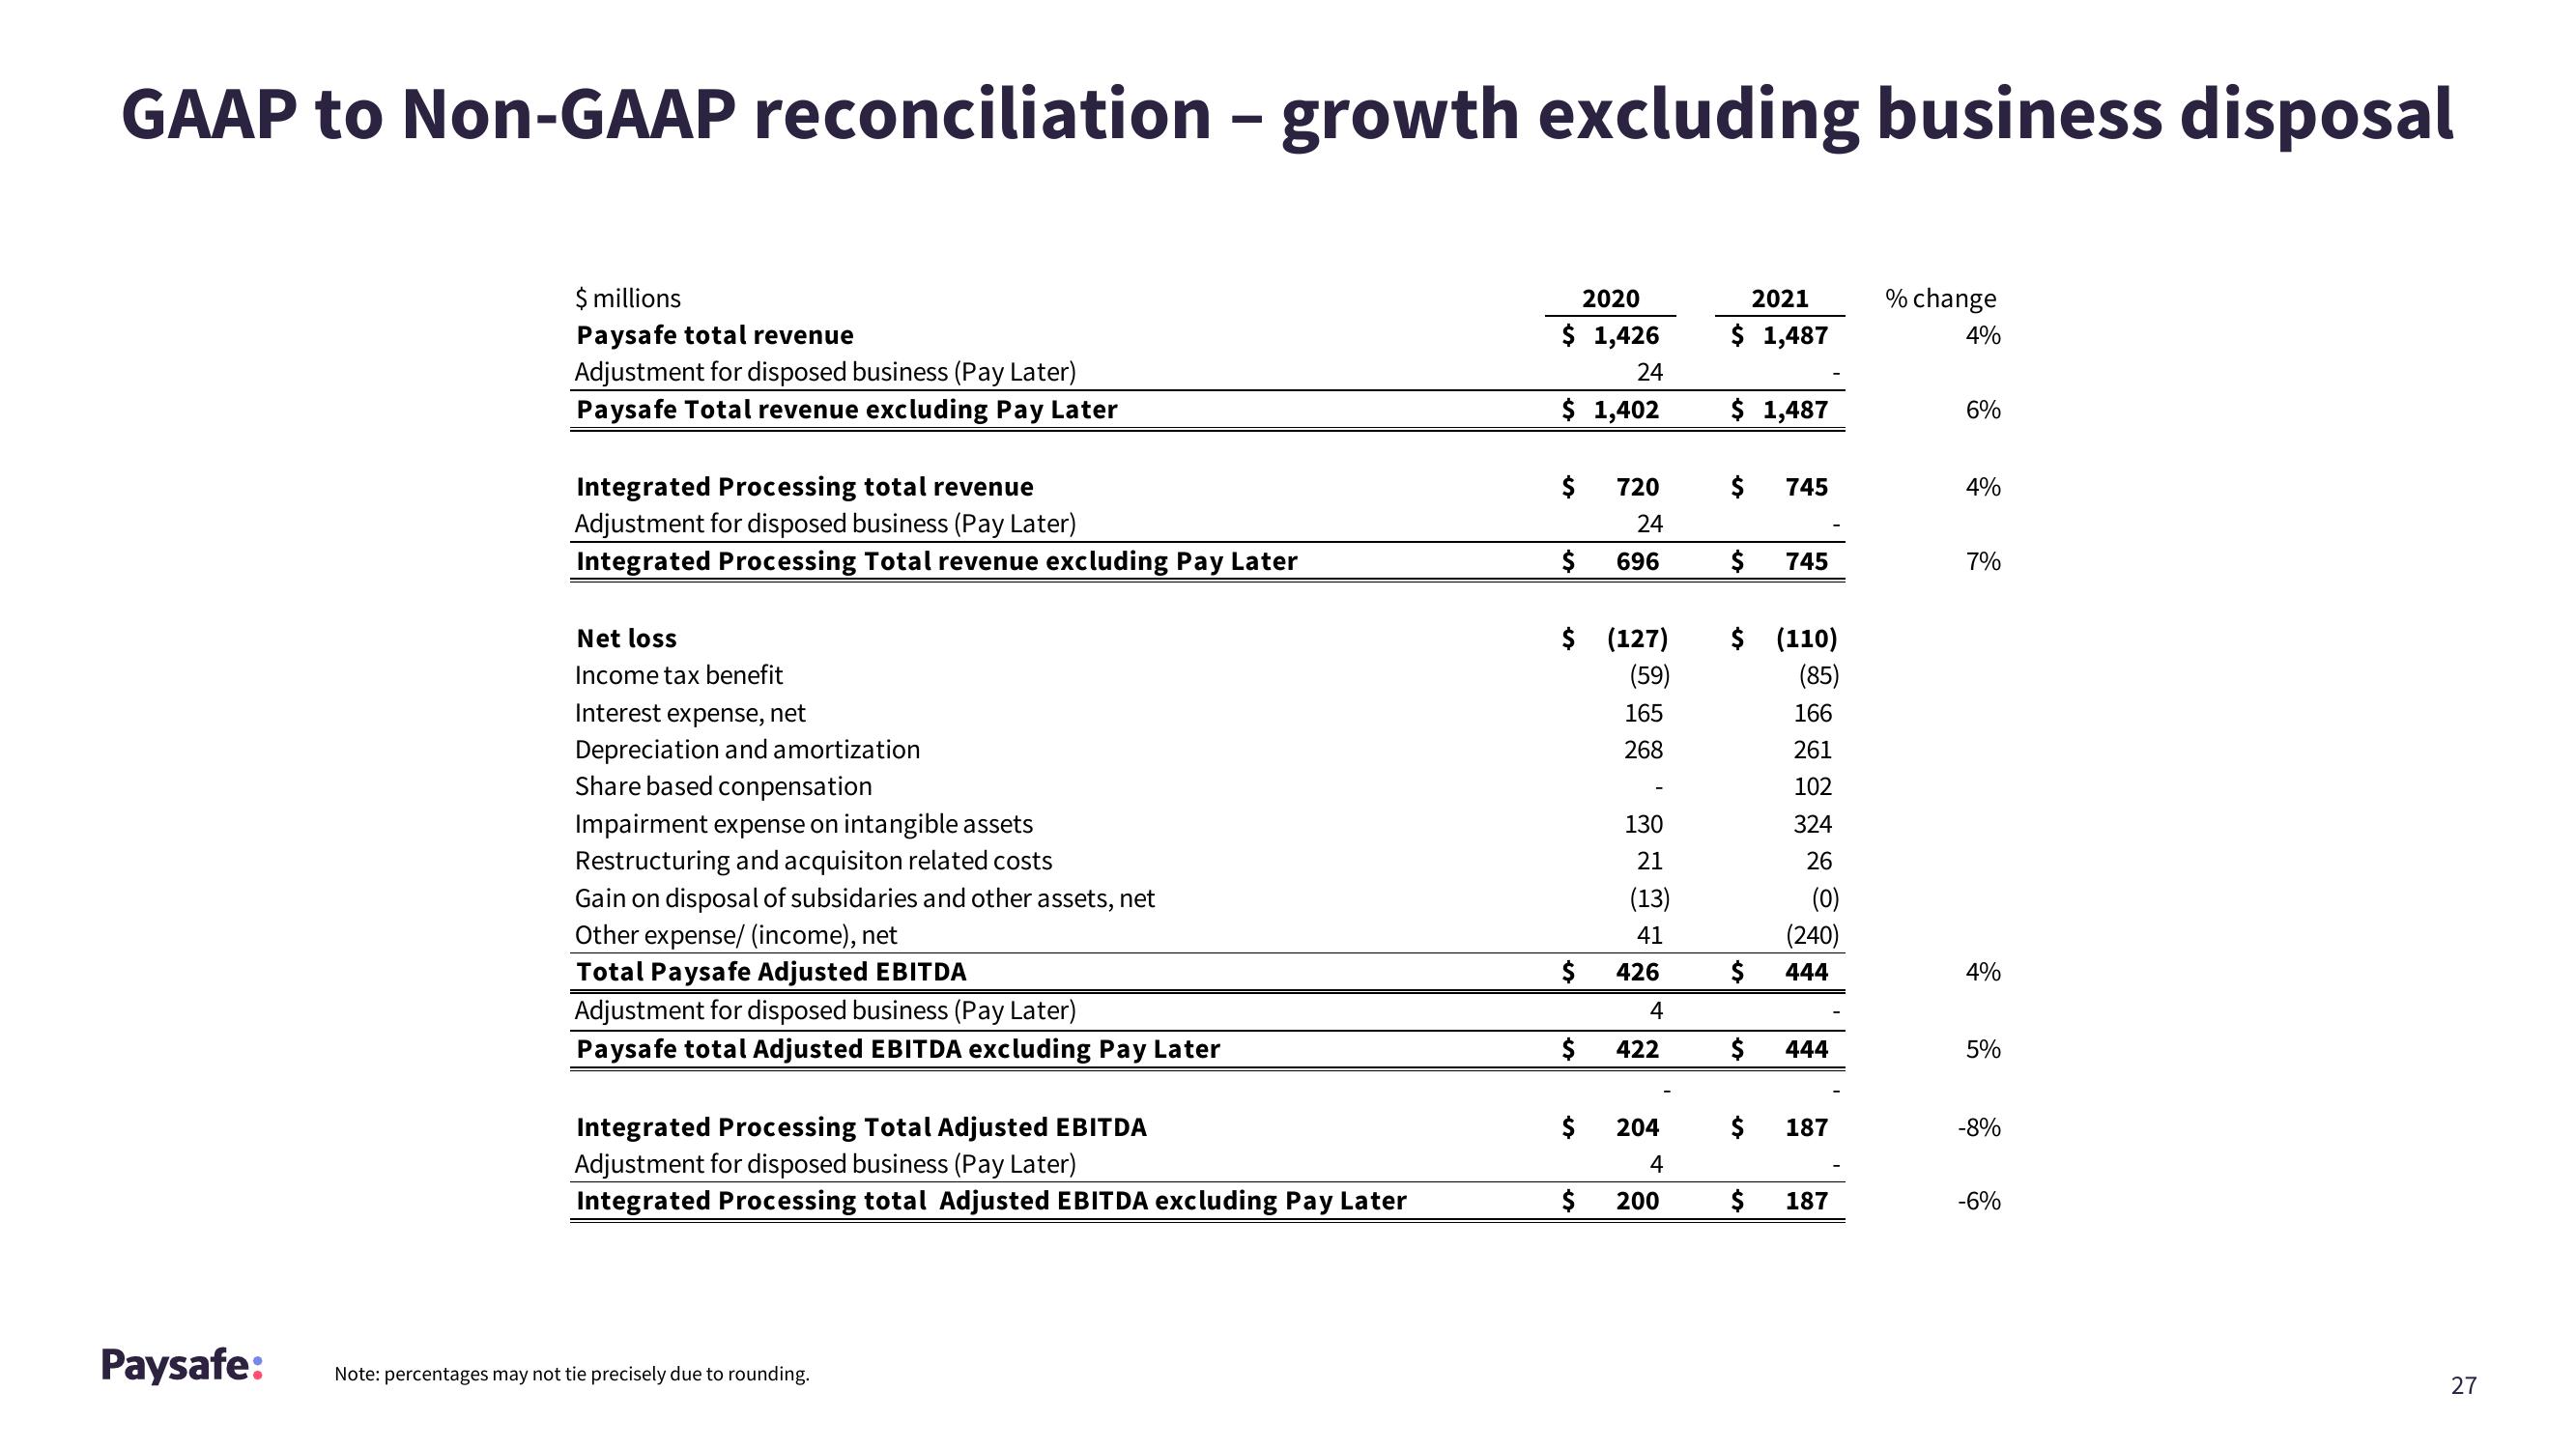
GAAP to Non-GAAP reconciliation - growth excluding business disposal
Paysafe:
$ millions
Paysafe total revenue
Adjustment for disposed business (Pay Later)
Paysafe Total revenue excluding Pay Later
Integrated Processing total revenue
Adjustment for disposed business (Pay Later)
Integrated Processing Total revenue excluding Pay Later
Net loss
Income tax benefit
Interest expense, net
Depreciation and amortization
Share based conpensation
Impairment expense on intangible assets
Restructuring and acquisiton related costs
Gain on disposal of subsidaries and other assets, net
Other expense/ (income), net
Total Paysafe Adjusted EBITDA
Adjustment for disposed business (Pay Later)
Paysafe total Adjusted EBITDA excluding Pay Later
Integrated Processing Total Adjusted EBITDA
Adjustment for disposed business (Pay Later)
Integrated Processing total Adjusted EBITDA excluding Pay Later
Note: percentages may not tie precisely due to rounding.
2020
$ 1,426
24
$ 1,402
$
$
$
$ (127)
(59)
$
$
720
24
$
696
165
268
130
21
(13)
41
426
4
422
204
4
200
2021
$ 1,487
$ 1,487
$ 745
$
$ (110)
(85)
$
$
$
745
$
166
261
102
324
26
(0)
(240)
444
444
187
187
% change
4%
6%
4%
7%
4%
5%
-8%
-6%
27View entire presentation