Silicon Valley Bank Results Presentation Deck
A high quality balance sheet
At 6/30/2019
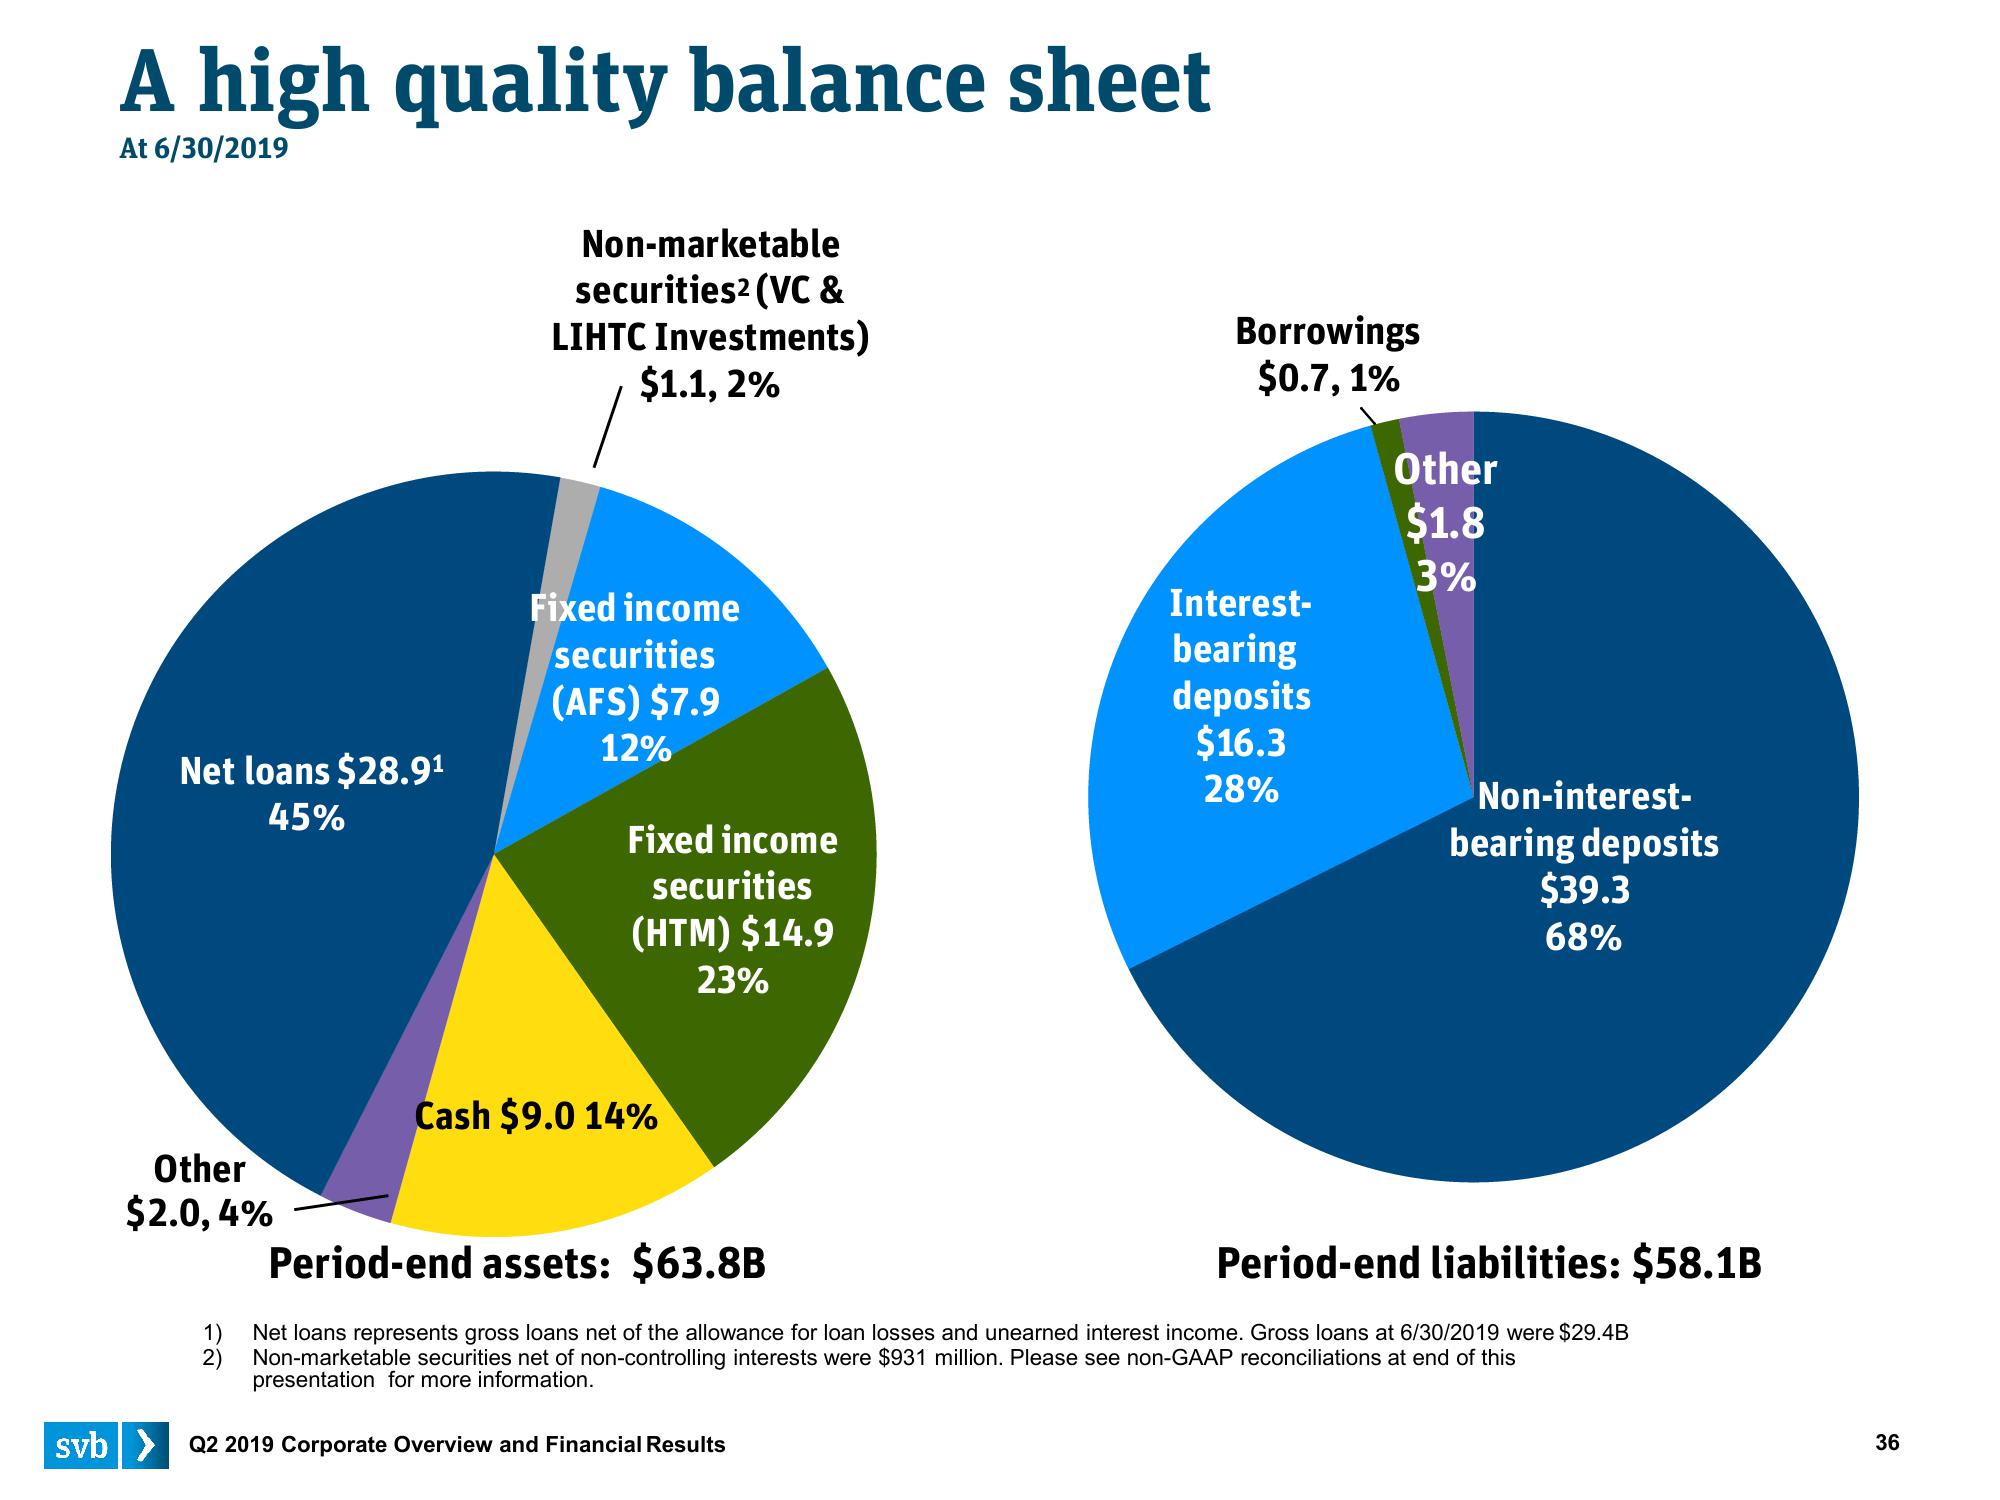
Net loans $28.9¹
45%
Other
$2.0, 4%
1)
2)
Non-marketable
securities² (VC &
LIHTC Investments)
$1.1, 2%
Fixed income
securities
(AFS) $7.9
12%
Fixed income
securities
(HTM) $14.9
23%
Cash $9.0 14%
Borrowings
$0.7, 1%
svb> Q2 2019 Corporate Overview and Financial Results
Interest-
bearing
deposits
$16.3
28%
Other
$1.8
3%
Non-interest-
bearing deposits
$39.3
68%
Period-end assets: $63.8B
Period-end liabilities: $58.1B
Net loans represents gross loans net of the allowance for loan losses and unearned interest income. Gross loans at 6/30/2019 were $29.4B
Non-marketable securities net of non-controlling interests were $931 million. Please see non-GAAP reconciliations at end of this
presentation for more information.
36View entire presentation