Overstock Investor Presentation Deck
Home-only Active Customers and Revenue
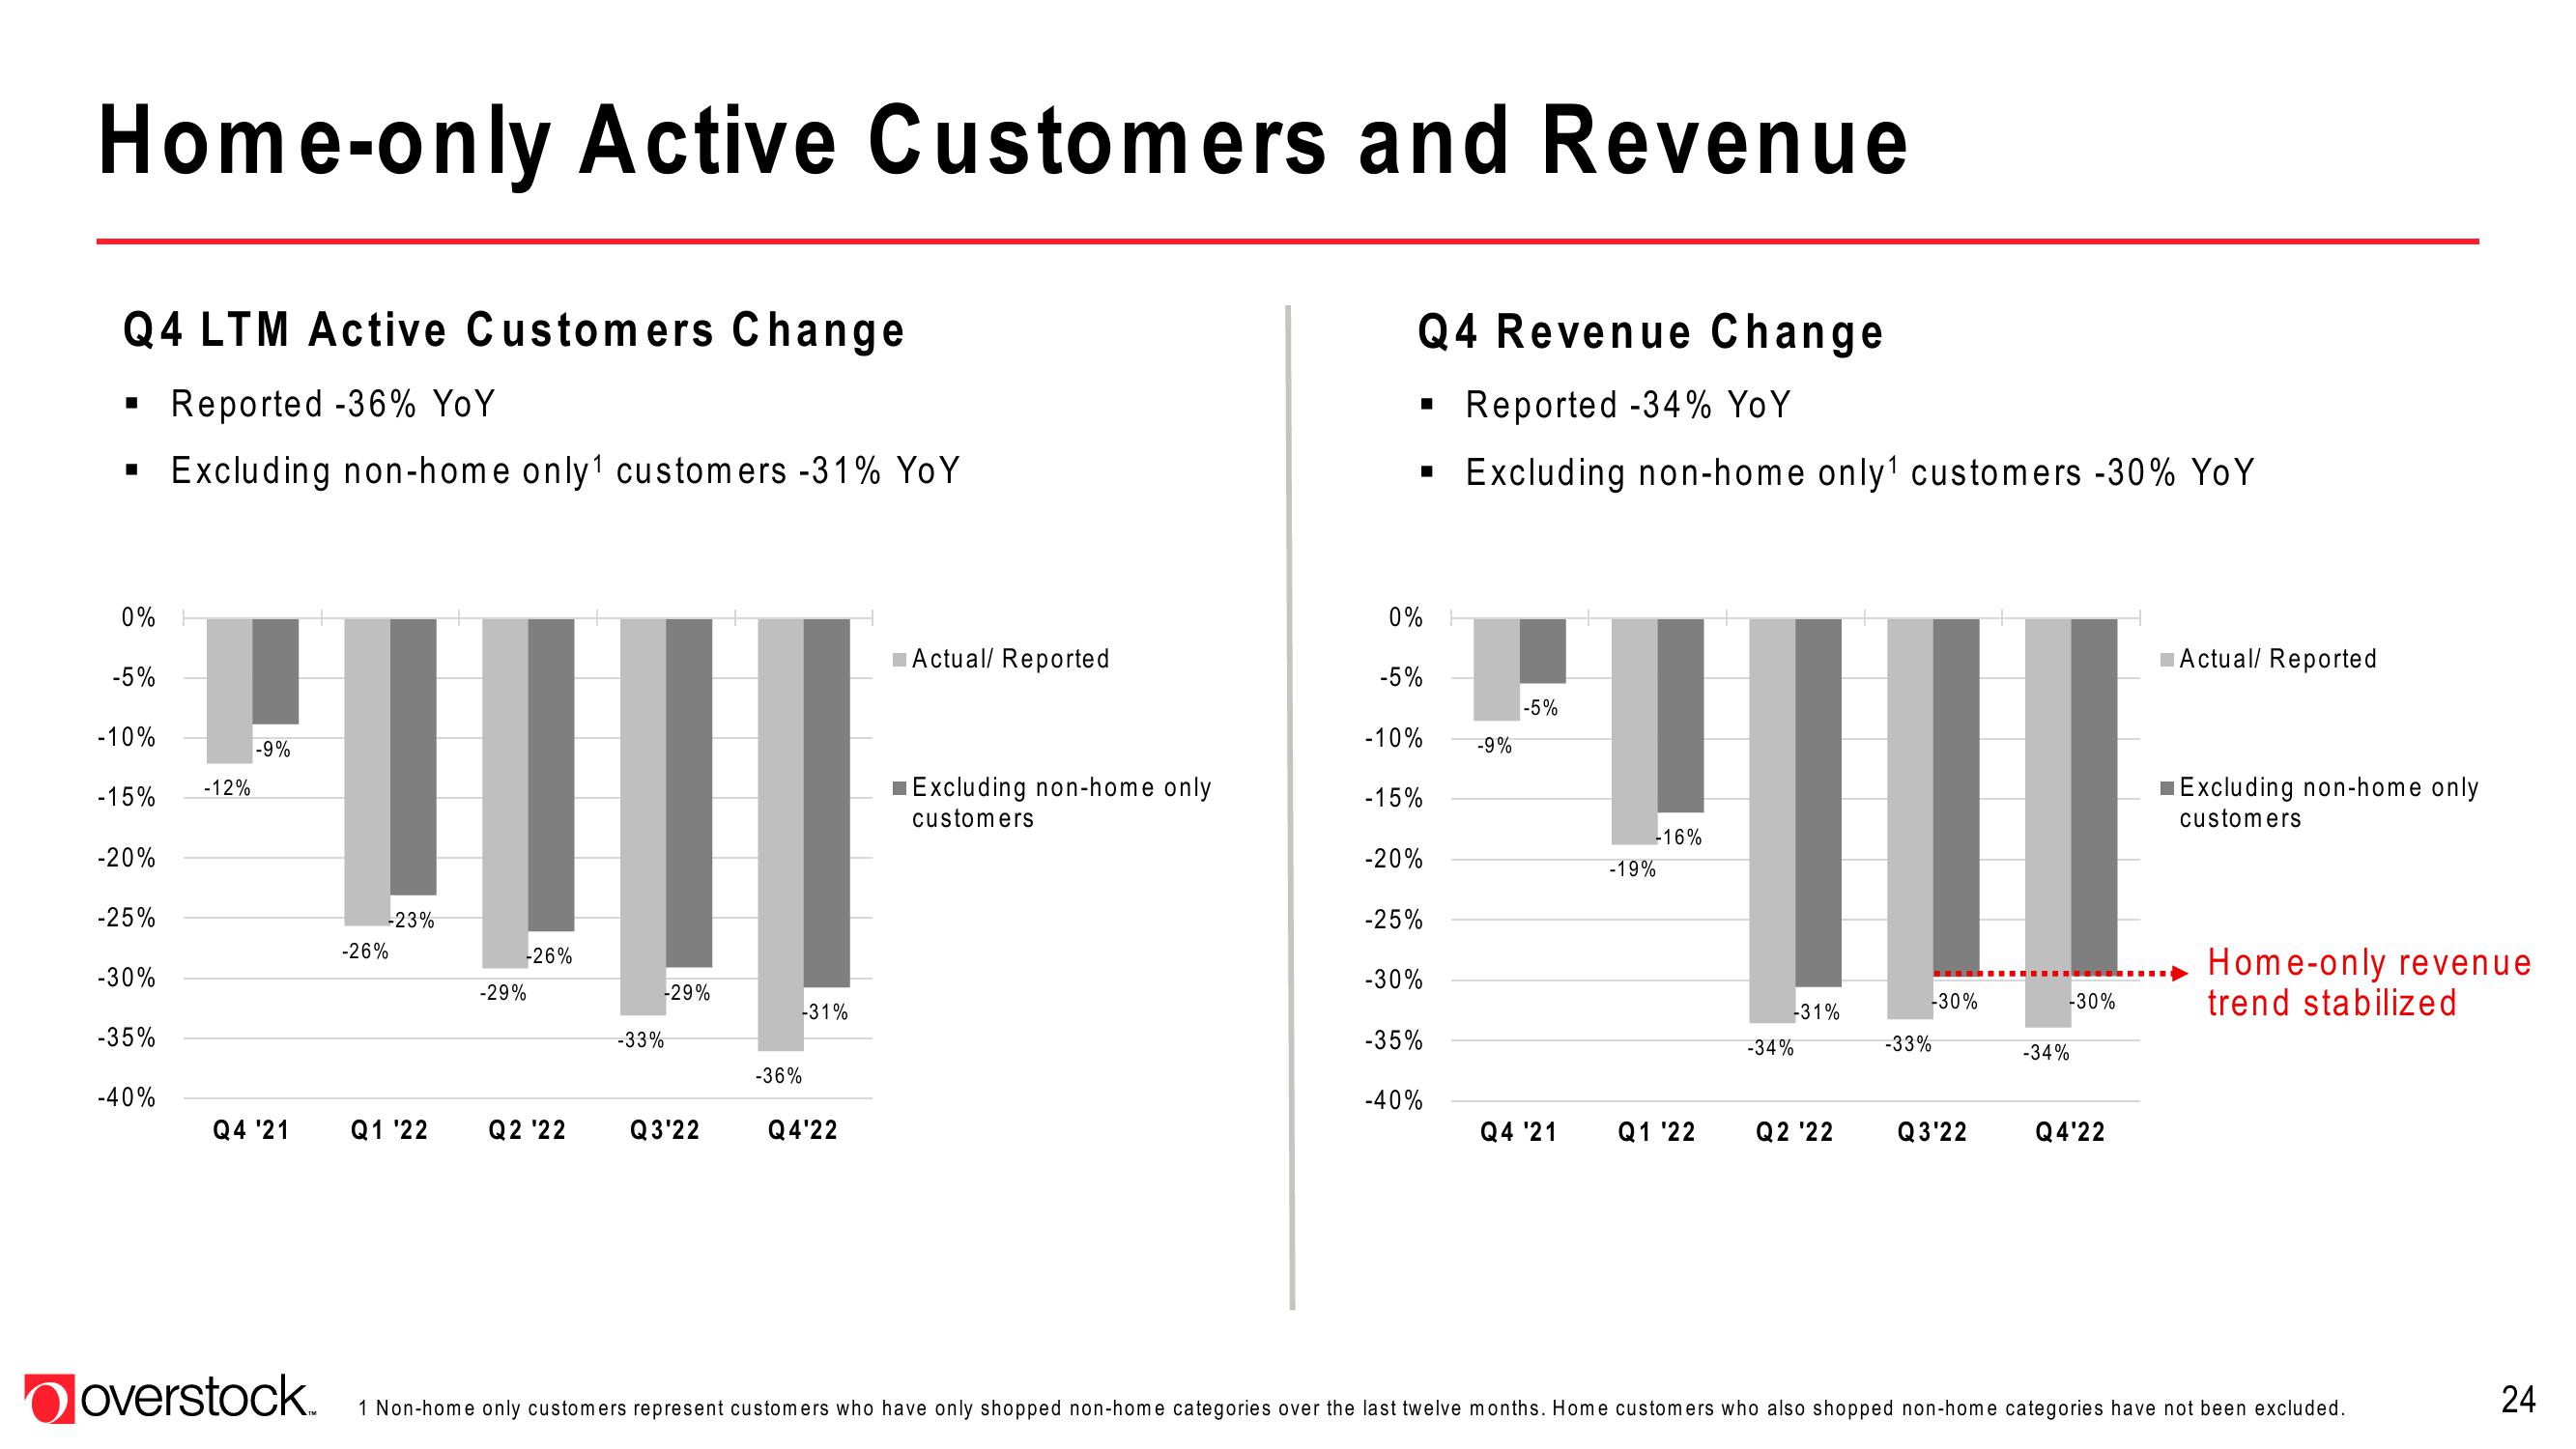
Q4 LTM Active Customers Change
Reported -36% YoY
Excluding non-home only¹ customers -31% YoY
■
0%
-5%
-10%
-15%
-20%
-25%
-30%
-35%
-40%
-12%
-9%
Q4 '21
overstock.
-23%
-26%
-26%
-29%
Q1 '22 Q2 '22
-33%
-29%
Q3'22
-31%
-36%
Q4'22
Actual/ Reported
Excluding non-home only
customers
Q4 Revenue Change
Reported -34% YoY
Excluding non-home only¹ customers -30% YoY
0%
-5%
-10%
-15%
-20%
-25%
-30%
-35%
-40%
-9%
-5%
Q4 '21
-16%
-19%
Q1 '22
-31%
-34%
Q2 '22
-30%
-33%
Q3'22
-30%
-34%
Q4'22
Actual/ Reported
Excluding non-home only
customers
Home-only revenue
trend stabilized
1 Non-home only customers represent customers who have only shopped non-home categories over the last twelve months. Home customers who also shopped non-home categories have not been excluded.
24View entire presentation