Antofagasta Investor Day
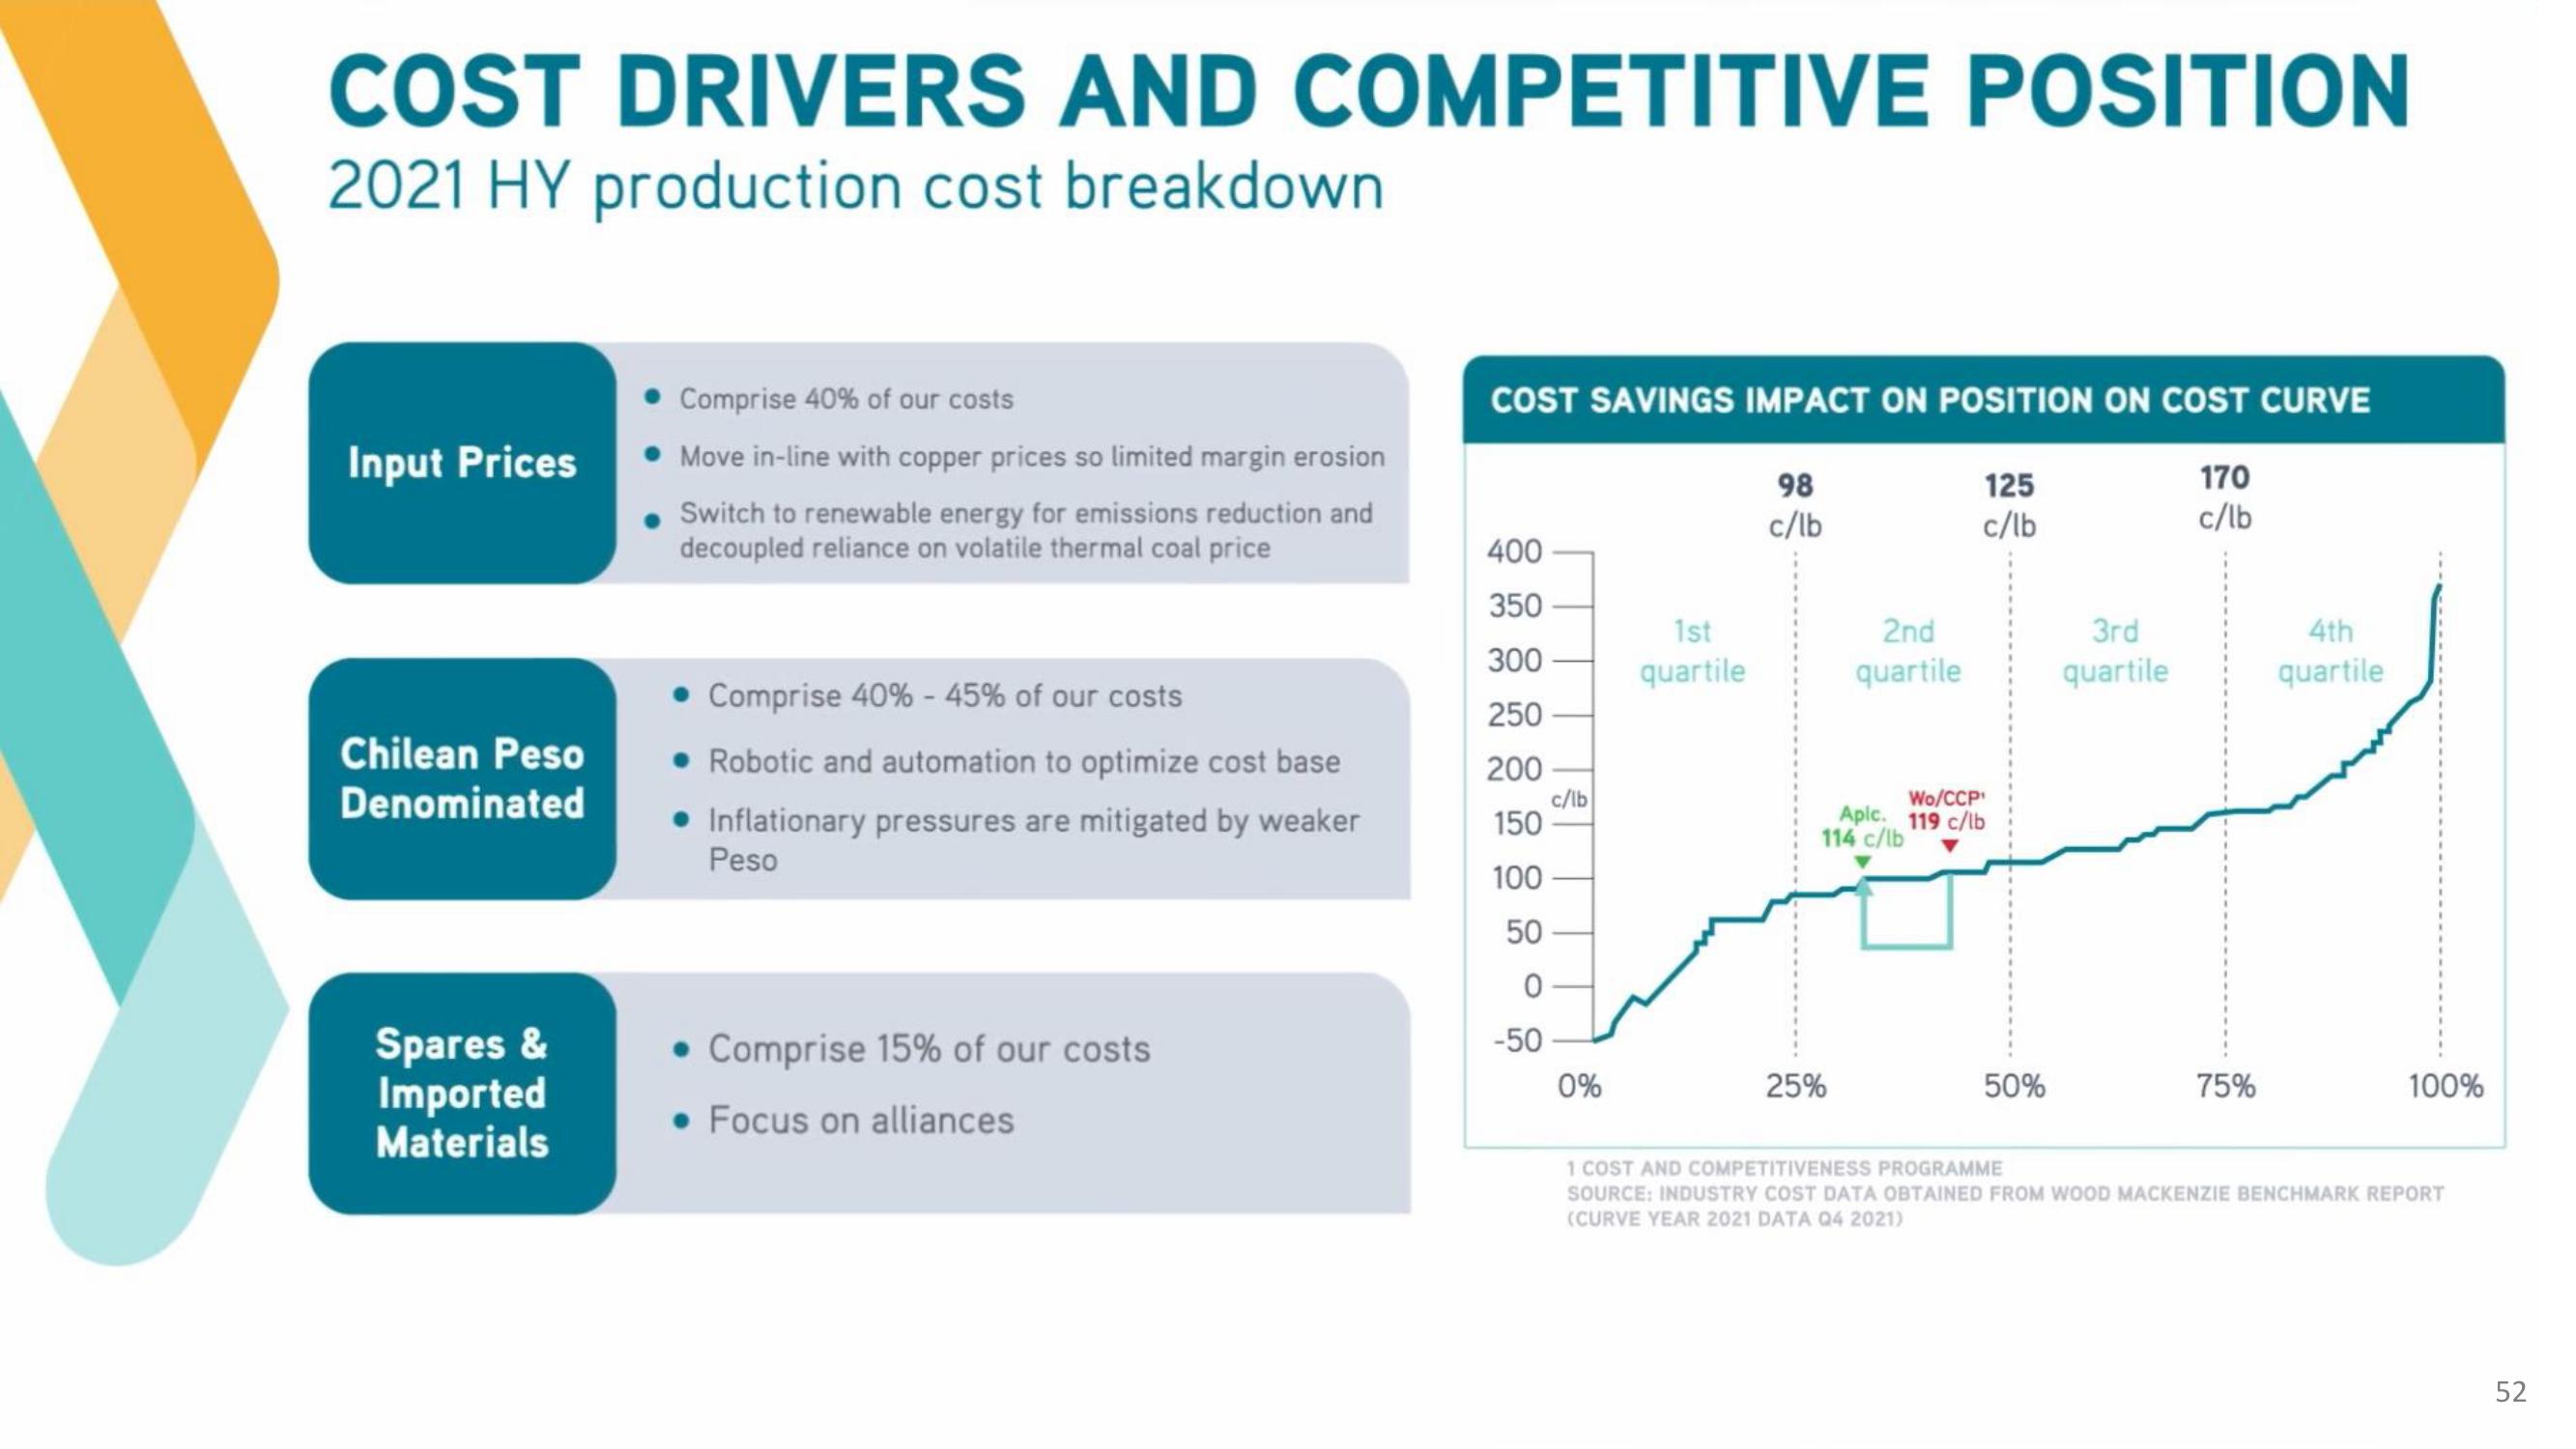
COST DRIVERS AND COMPETITIVE POSITION
2021 HY production cost breakdown
Input Prices
Chilean Peso
Denominated
Spares &
Imported
Materials
Comprise 40% of our costs
Move in-line with copper prices so limited margin erosion
Switch to renewable energy for emissions reduction and
decoupled reliance on volatile thermal coal price
Comprise 40% -45% of our costs
• Robotic and automation to optimize cost base
• Inflationary pressures are mitigated by weaker
Peso
• Comprise 15% of our costs
• Focus on alliances
COST SAVINGS IMPACT ON POSITION ON COST CURVE
400
350
300
250
200
150
100
50
0
-50
c/lb
0%
1st
quartile
98
c/lb
2nd
quartile
25%
125
c/lb
Wo/CCP¹
Apic. 119 c/lb
114 c/lb
50%
3rd
quartile
170
c/lb
75%
4th
quartile
100%
1 COST AND COMPETITIVENESS PROGRAMME
SOURCE: INDUSTRY COST DATA OBTAINED FROM WOOD MACKENZIE BENCHMARK REPORT
(CURVE YEAR 2021 DATA Q4 2021)
52View entire presentation