NewFortress Energy 2Q23 Results
(in thousands of $)
Appendix
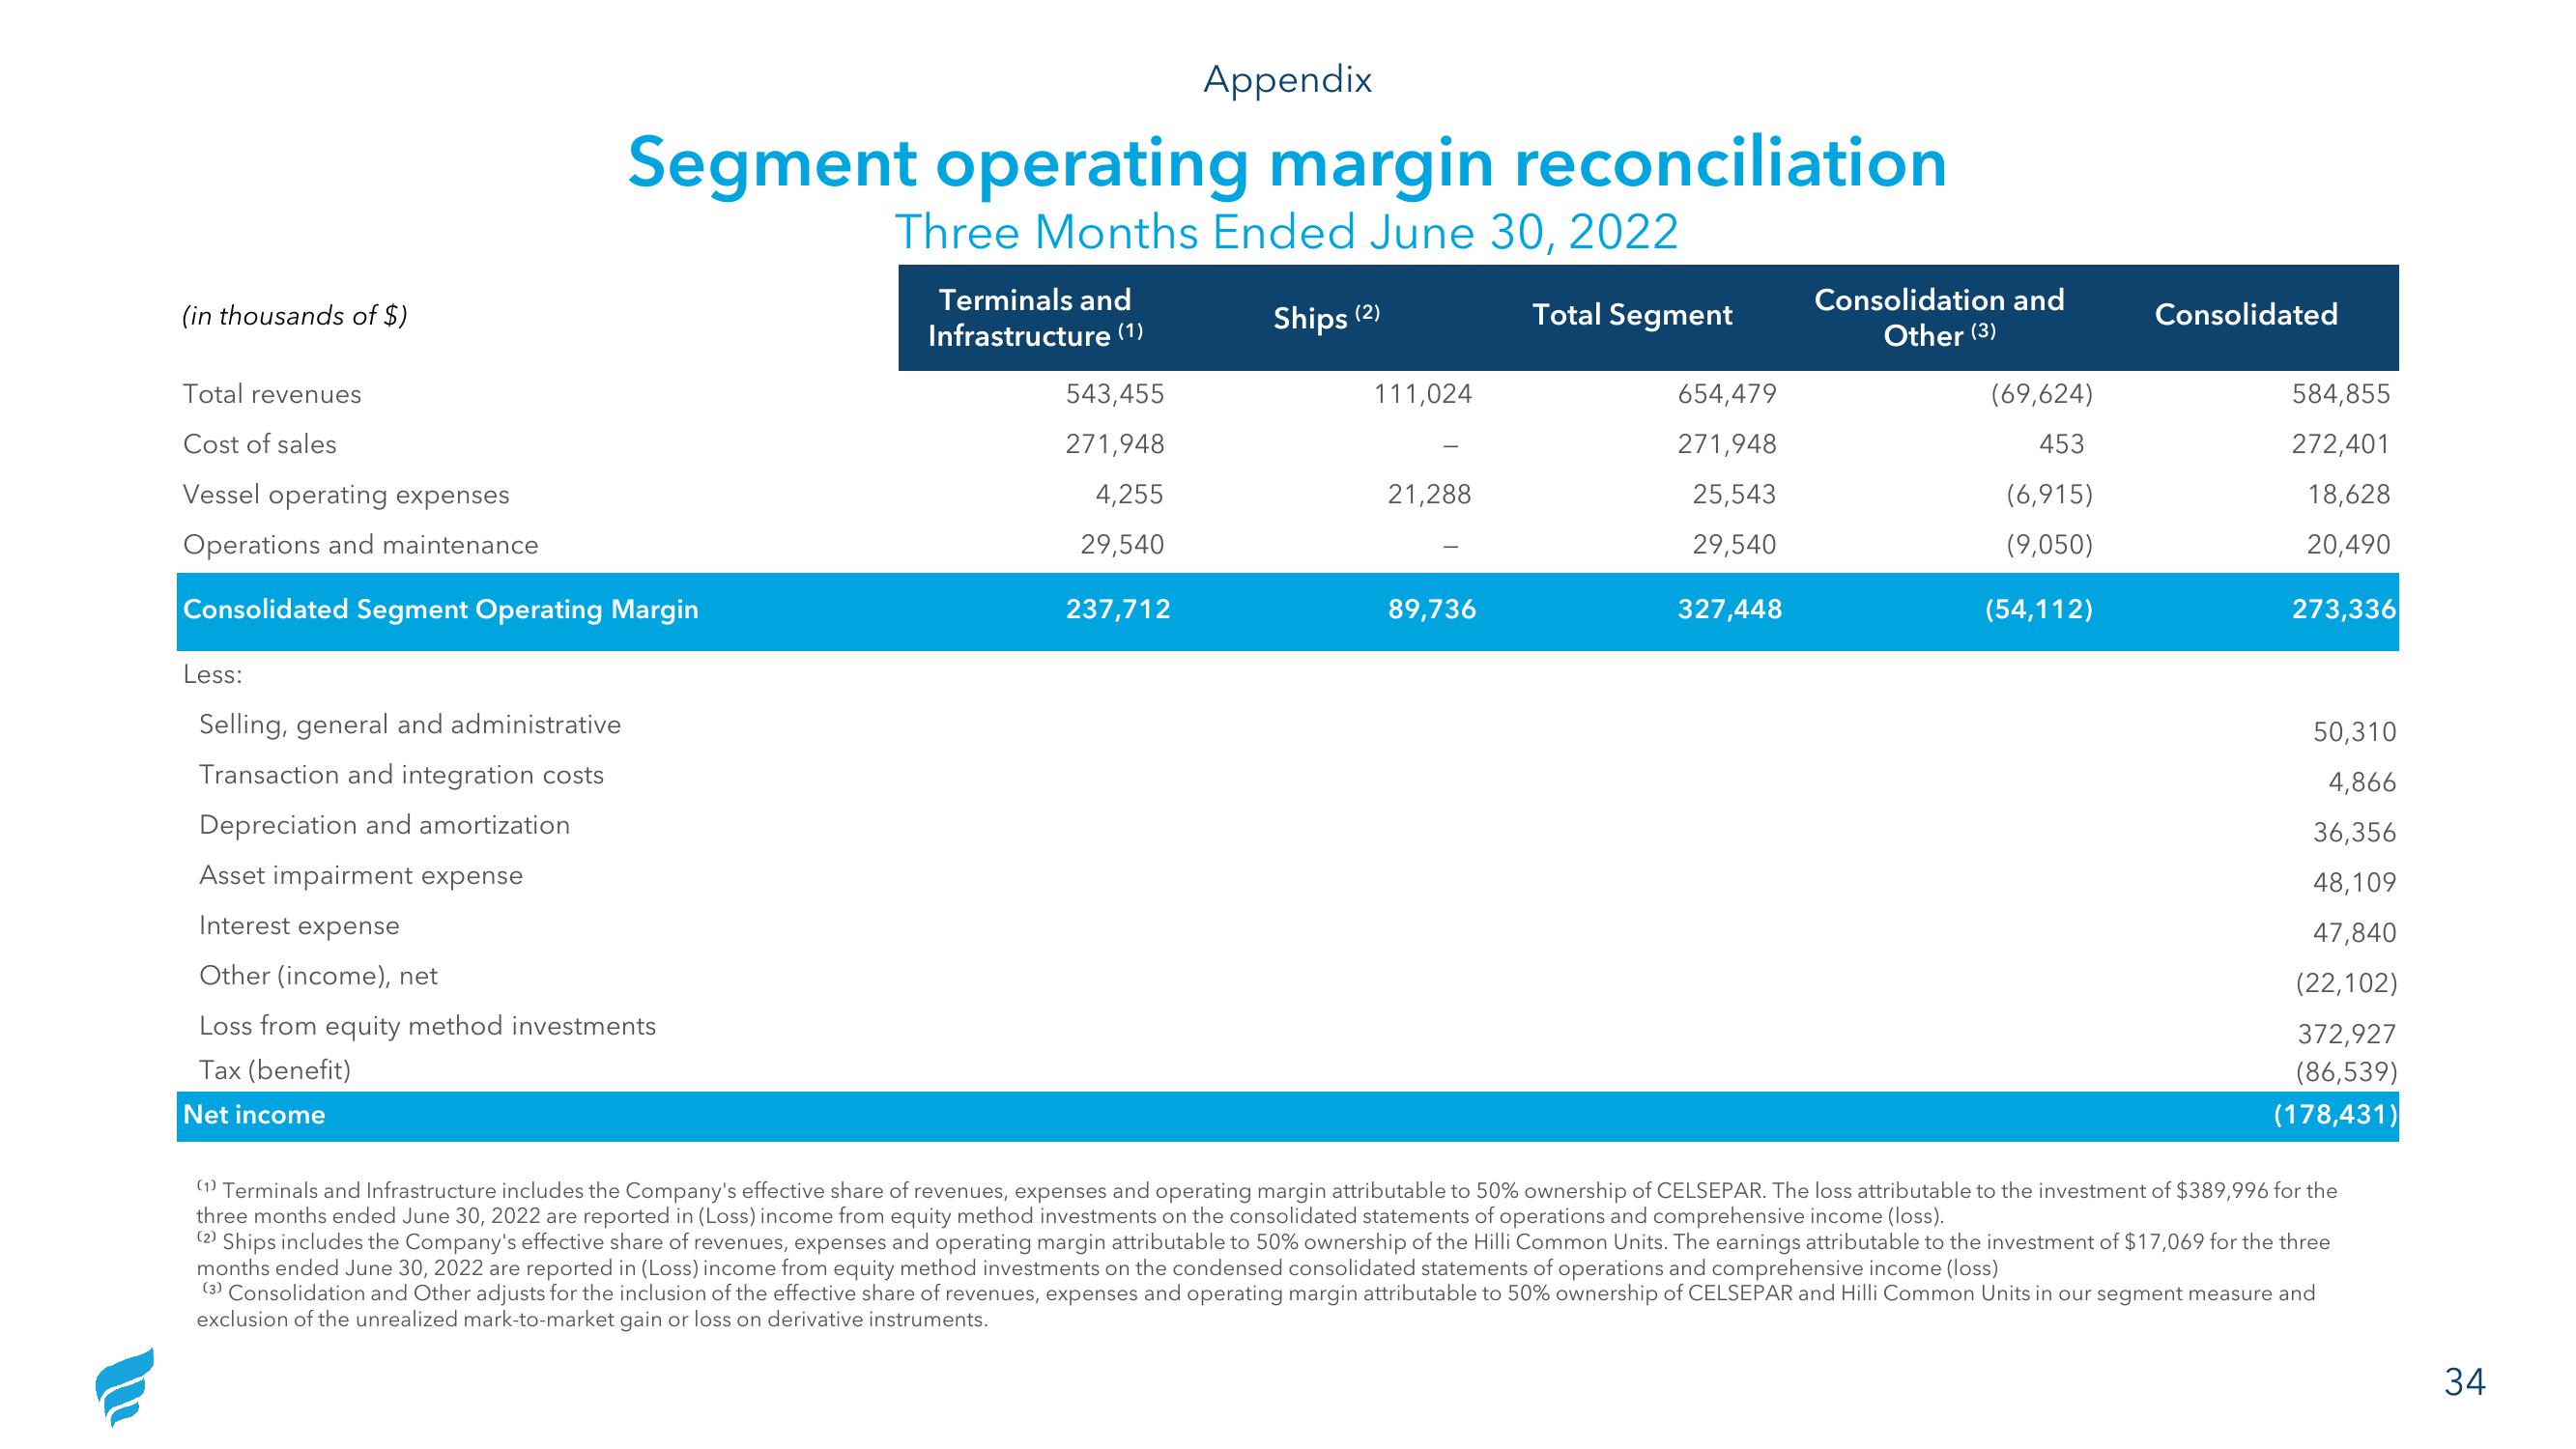
Segment operating margin reconciliation
Three Months Ended June 30, 2022
Total revenues
Cost of sales
Vessel operating expenses
Operations and maintenance
Consolidated Segment Operating Margin
Less:
Selling, general and administrative
Transaction and integration costs
Depreciation and amortization
Asset impairment expense
Interest expense
Other (income), net
Loss from equity method investments
Tax (benefit)
Net income
Terminals and
Infrastructure (1)
543,455
271,948
4,255
29,540
237,712
Ships
(2)
111,024
21,288
89,736
Total Segment
654,479
271,948
25,543
29,540
327,448
Consolidation and
Other (3)
(69,624)
453
(6,915)
(9,050)
(54,112)
Consolidated
584,855
272,401
18,628
20,490
273,336
50,310
4,866
36,356
48,109
47,840
(22,102)
372,927
(86,539)
(178,431)
(1) Terminals and Infrastructure includes the Company's effective share of revenues, expenses and operating margin attributable to 50% ownership of CELSEPAR. The loss attributable to the investment of $389,996 for the
three months ended June 30, 2022 are reported in (Loss) income from equity method investments on the consolidated statements of operations and comprehensive income (loss).
(2) Ships includes the Company's effective share of revenues, expenses and operating margin attributable to 50% ownership of the Hilli Common Units. The earnings attributable to the investment of $17,069 for the three
months ended June 30, 2022 are reported in (Loss) income from equity method investments on the condensed consolidated statements of operations and comprehensive income (loss)
(3) Consolidation and Other adjusts for the inclusion of the effective share of revenues, expenses and operating margin attributable to 50% ownership of CELSEPAR and Hilli Common Units in our segment measure and
exclusion of the unrealized mark-to-market gain or loss on derivative instruments.
34View entire presentation