J.P.Morgan Results Presentation Deck
JPMORGAN CHASE & CO.
CORPORATE
FINANCIAL HIGHLIGHTS
(in millions, except headcount data)
INCOME STATEMENT
REVENUE
Principal transactions
Investment securities gains/(losses)
All other income
Noninterest revenue
Net interest income
TOTAL NET REVENUE (a)
Provision for credit losses
NONINTEREST EXPENSE
Income/(loss) before income tax expense/(benefit)
Income tax expense/(benefit) (b)
NET INCOME/(LOSS) (b)
MEMO:
TOTAL NET REVENUE
Treasury and Chief Investment Office ("CIO")
Other Corporate
TOTAL NET REVENUE
NET INCOME/(LOSS)
Treasury and CIO
Other Corporate (b)
TOTAL NET INCOME/(LOSS) (b)
SELECTED BALANCE SHEET DATA (period-end)
Total assets
Loans
Deposits
Headcount
SUPPLEMENTAL INFORMATION
TREASURY and CIO
Investment securities gains/(losses)
Available-for-sale securities (average)
Held-to-maturity securities (average) (c)
Investment securities portfolio (average)
Available-for-sale securities (period-end)
Held-to-maturity securities, net of allowance for credit losses.
(period-end) (c)
Investment securities portfolio, net of allowance for credit losses
(period-end) (d)
$
$
$
$
$
$
2Q22
$
17
(153)
(108)
(244)
324
80
28
206
(154)
20
(174)
82
$ 1,459,528
(2)
80
88
(262)
(174)
2,187
13,191 (e)
40,348
(153)
252,121
418,843
670,964
220,213
441,649
661,862
$
1Q22
$
***********
(161)
(394)
(345)
(536)
(881)
(1,094)
(238)
(856)
(944)
63
(881)
(748)
(108)
(856)
$ 1,539,844
1,957
1,434
39,802
(394)
304,314
364,814
669,128
310,909
366,585
677,494
$
$
4Q21
$
QUARTERLY TRENDS
********
(681)
(545)
(819)
(169)
(650)
(480)
(65)
(545)
$1,518,100
1,770
396
(428)
(222)
(650)
38,952
52
290,590
349,989
640,579
306,352
363,707
$ 670,059
***
$
3Q21
$
(103)
(256)
117
(242)
(1,054)
(1,296)
(7)
160
(1,449)
(533)
(916)
(1,198)
(98)
(1,296)
(998)
82
(916)
$ 1,459,283
1,697
546
38,302
(256)
223,747
339,544
$ 563,291
249,484
343,542
593,026
$
$
$
2Q21
$
(8)
(155)
(45)
$
(208)
(961)
(1,169)
(1,081)
(88)
$ (1,169)
49
515
(1,733)
(438)
(1,295)
$ 1,382,653
1,530
372
(956)
(339)
(1,295)
37,520
(155)
342,338
240,696
583,034
230,127
341,476
$ 571,603
2Q22 Change
1Q22
NM
61%
NM
29
NM
NM
(3)
12
86
NM
80
NM
NM
NM
NM
(143)
80
(5)
12
NM
1
61
(17)
15
(29)
20
(2)
JPMORGAN CHASE & CO.
2Q21
NM
1%
(140)
(17)
NM
NM
(43)
(60)
91
NM
87
NM
98
NM
NM
23
87
6
43
NM
8
1
(26)
74
15
(4)
29
16
$
$
2022
SIX MONTHS ENDED JUNE 30,
*1
$
(144)
(547)
102
$
(589)
(212)
(801)
$
57
$ (1,030)
390
(1,248)
(218)
(660)
(370)
$ (1,030)
$ 1,459,528
2,187
13,191 (e)
(862)
61
(801)
40,348
(547)
278,073
391,978
670,051
220,213
441,649
661,862
$
$
$
$
$
2021
$
264
(141)
51
174
(1,816)
(1,642)
65
1,391
(3,098)
(951)
(2,147)
$ 1,382,653
1,530
372
(1,786)
144
(1,642)
(1,631)
(516)
(2,147)
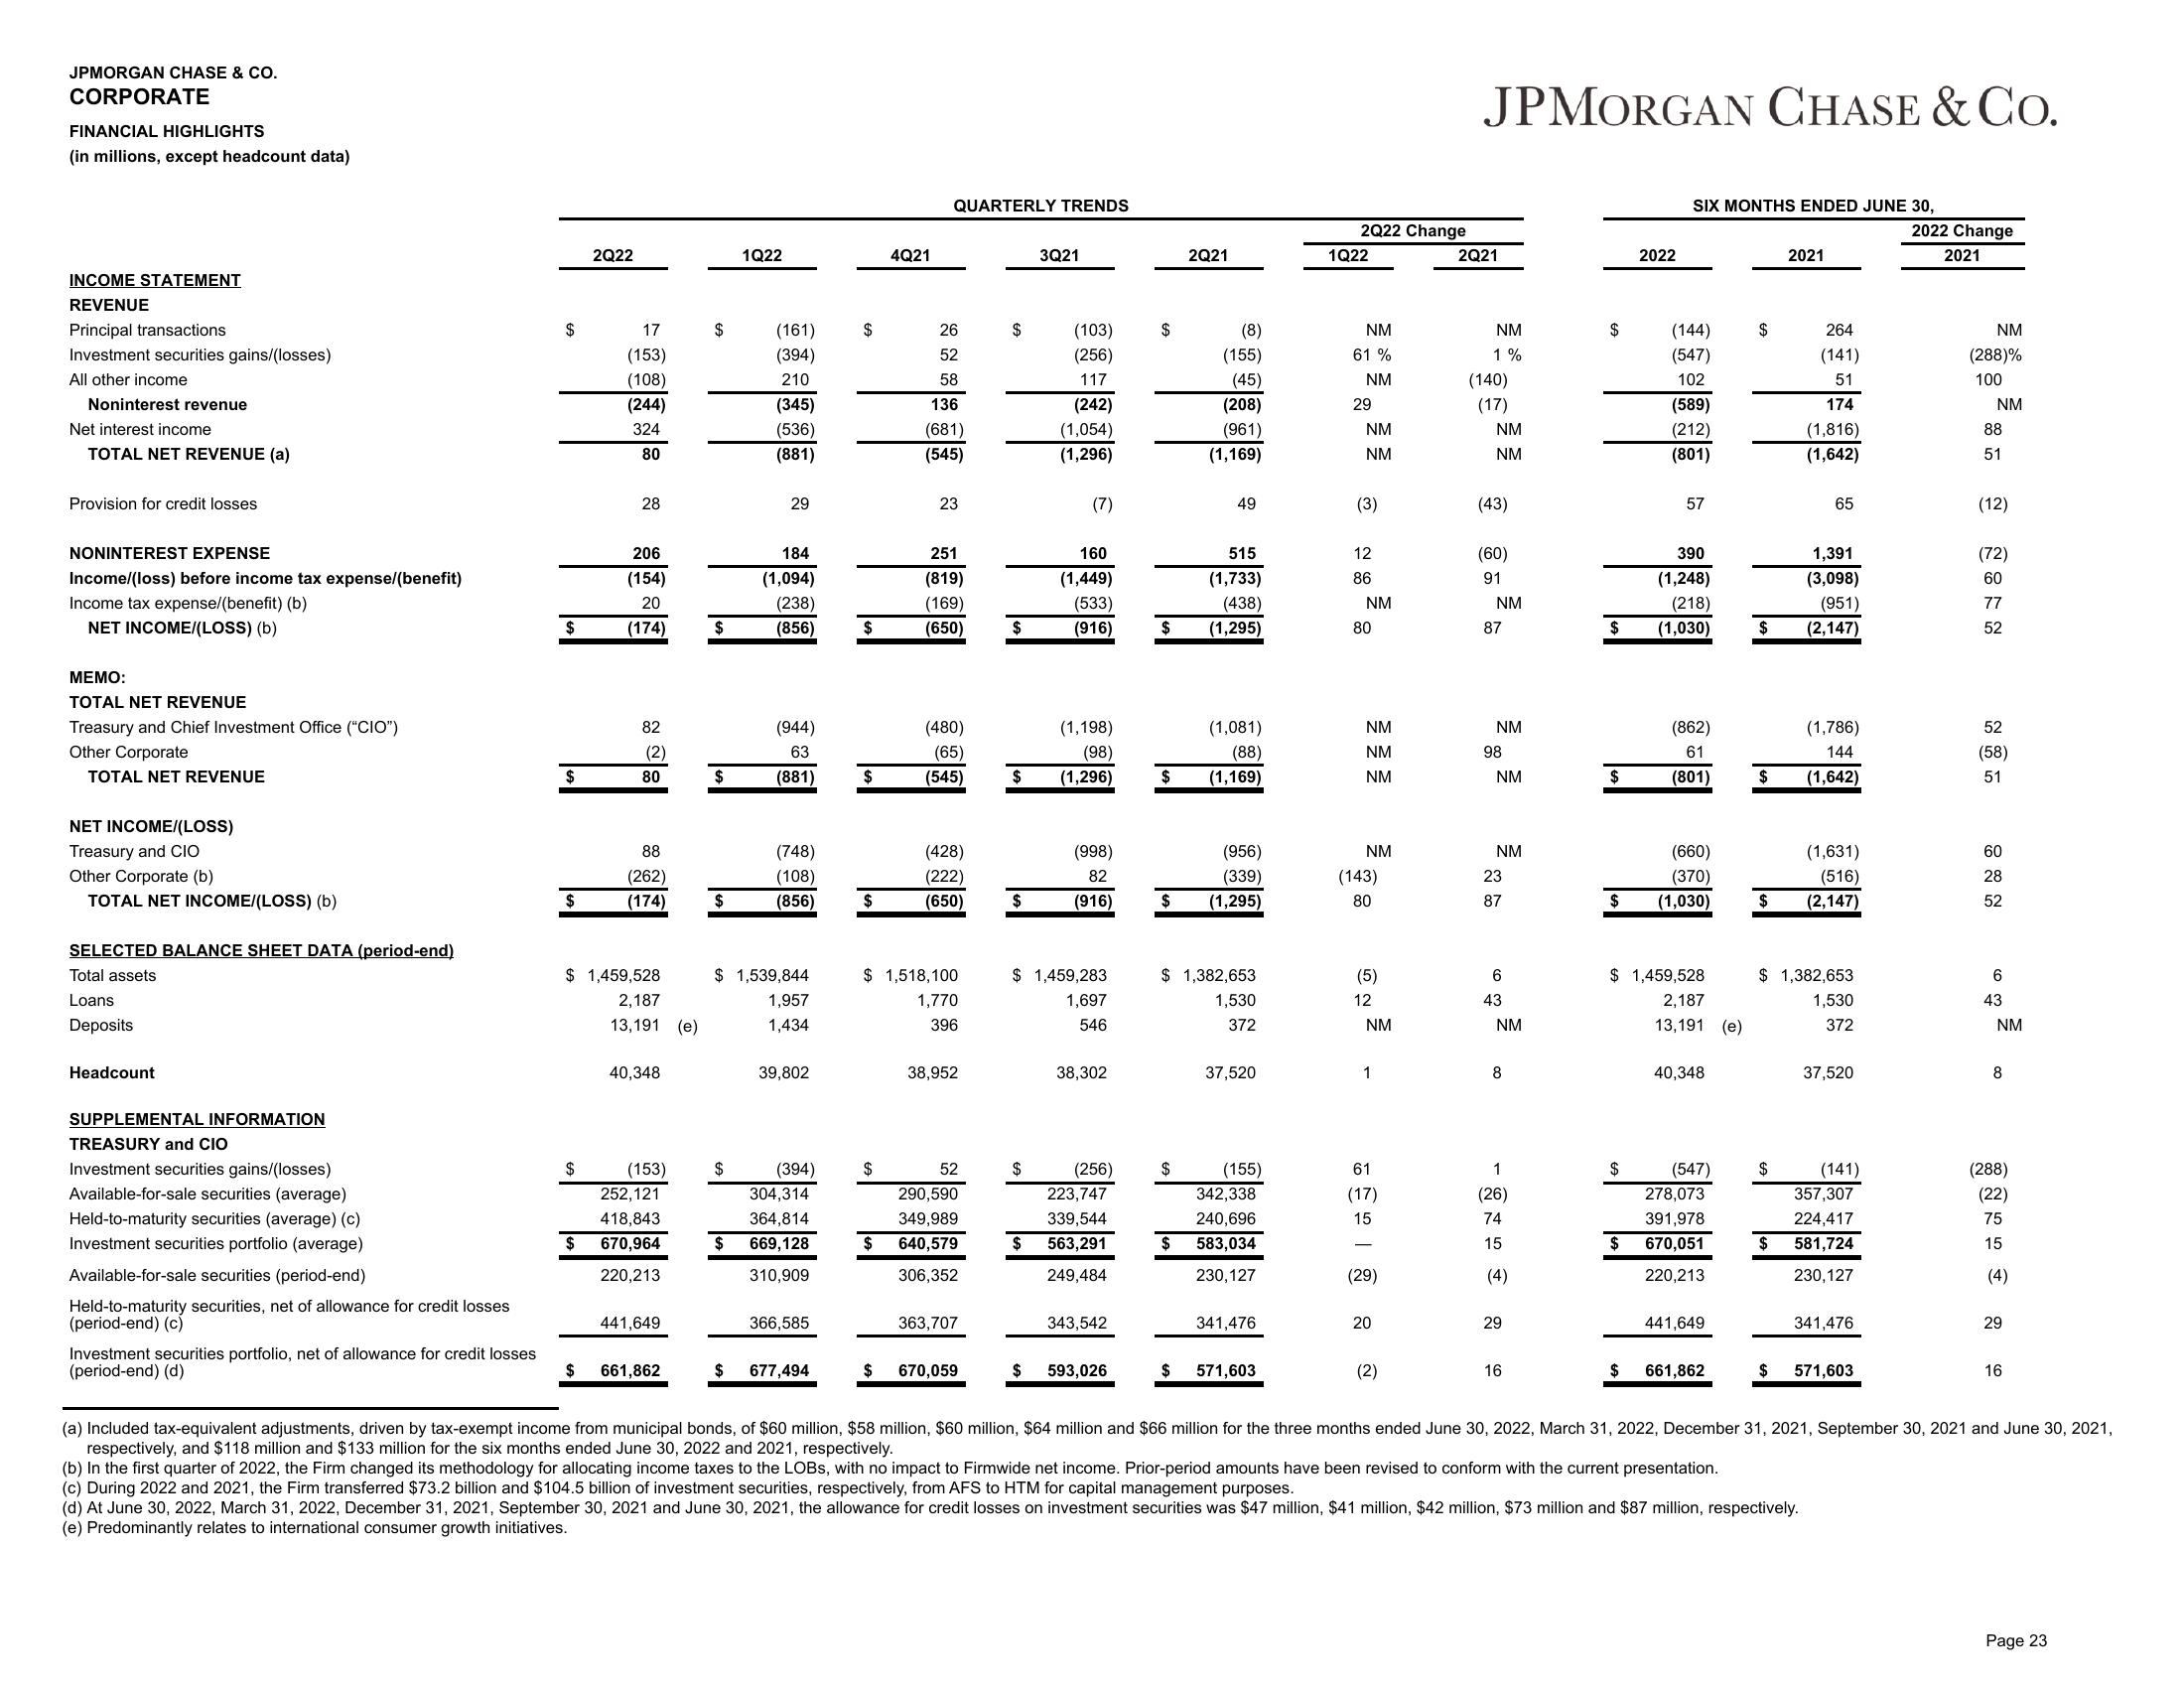
(c) During 2022 and 2021, the Firm transferred $73.2 billion and $104.5 billion of investment securities, respectively, from AFS to HTM for capital management purposes.
(d) At June 30, 2022, March 31, 2022, December 31, 2021, September 30, 2021 and June 30, 2021, the allowance for credit losses on investment securities was $47 million, $41 million, $42 million, $73 million and $87 million, respectively.
(e) Predominantly relates to international consumer growth initiatives.
37,520
(141)
357,307
224,417
581,724
230,127
341,476
571,603
2022 Change
2021
NM
(288)%
100
NM
88
51
(12)
(72)
60
77
52
52
(58)
51
60
28
52
6
43
NM
8
(288)
(22)
75
15
(4)
29
16
(a) Included tax-equivalent adjustments, driven by tax-exempt income from municipal bonds, of $60 million, $58 million, $60 million, $64 million and $66 million for the three months ended June 30, 2022, March 31, 2022, December 31, 2021, September 30, 2021 and June 30, 2021,
respectively, and $118 million and $133 million for the six months ended June 30, 2022 and 2021, respectively.
(b) In the first quarter of 2022, the Firm changed its methodology for allocating income taxes to the LOBS, with no impact to Firmwide net income. Prior-period amounts have been revised to conform with the current presentation.
Page 23View entire presentation