Dave Investor Presentation Deck
Improving delinquency
performance
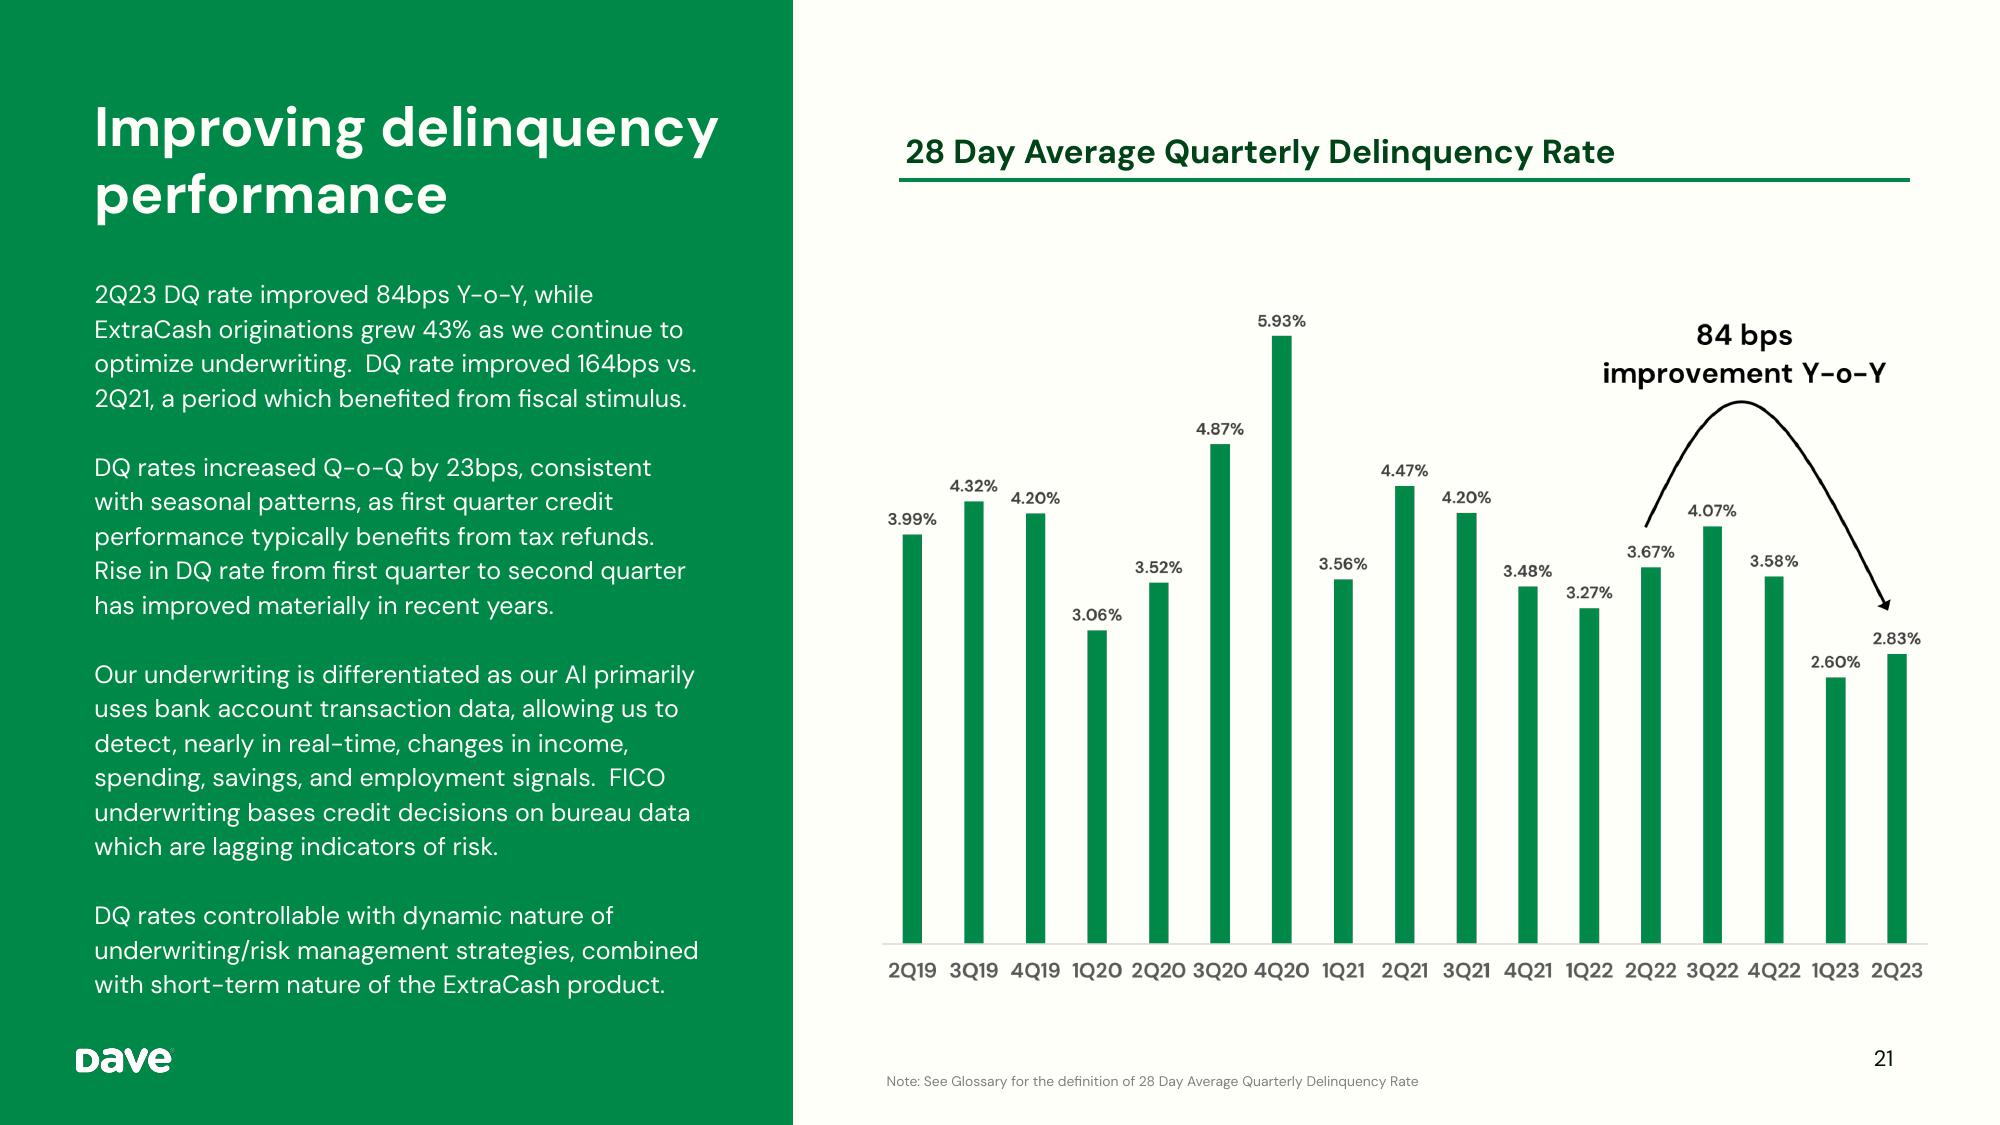
2Q23 DQ rate improved 84bps Y-o-Y, while
ExtraCash originations grew 43% as we continue to
optimize underwriting. DQ rate improved 164bps vs.
2Q21, a period which benefited from fiscal stimulus.
DQ rates increased Q-o-Q by 23bps, consistent
with seasonal patterns, as first quarter credit
performance typically benefits from tax refunds.
Rise in DQ rate from first quarter to second quarter
has improved materially in recent years.
Our underwriting is differentiated as our Al primarily
uses bank account transaction data, allowing us to
detect, nearly in real-time, changes in income,
spending, savings, and employment signals. FICO
underwriting bases credit decisions on bureau data
which are lagging indicators of risk.
DQ rates controllable with dynamic nature of
underwriting/risk management strategies, combined
with short-term nature of the ExtraCash product.
Dave
28 Day Average Quarterly Delinquency Rate
3.99%
4.32%
4.20%
3.06%
3.52%
4.87%
5.93%
3.56%
4.47%
4.20%
Note: See Glossary for the definition of 28 Day Average Quarterly Delinquency Rate
3.48%
84 bps
improvement Y-o-Y
3.27%
3.67%
4.07%
3.58%
2.60%
2.83%
|||||||
11
2Q19 3Q19 4Q19 1Q20 2Q20 3Q20 4Q20 1Q21 2Q21 3Q21 4Q21 1Q22 2Q22 3Q22 4Q22 1Q23 2Q23
21View entire presentation