Main Street Capital Investor Presentation Deck
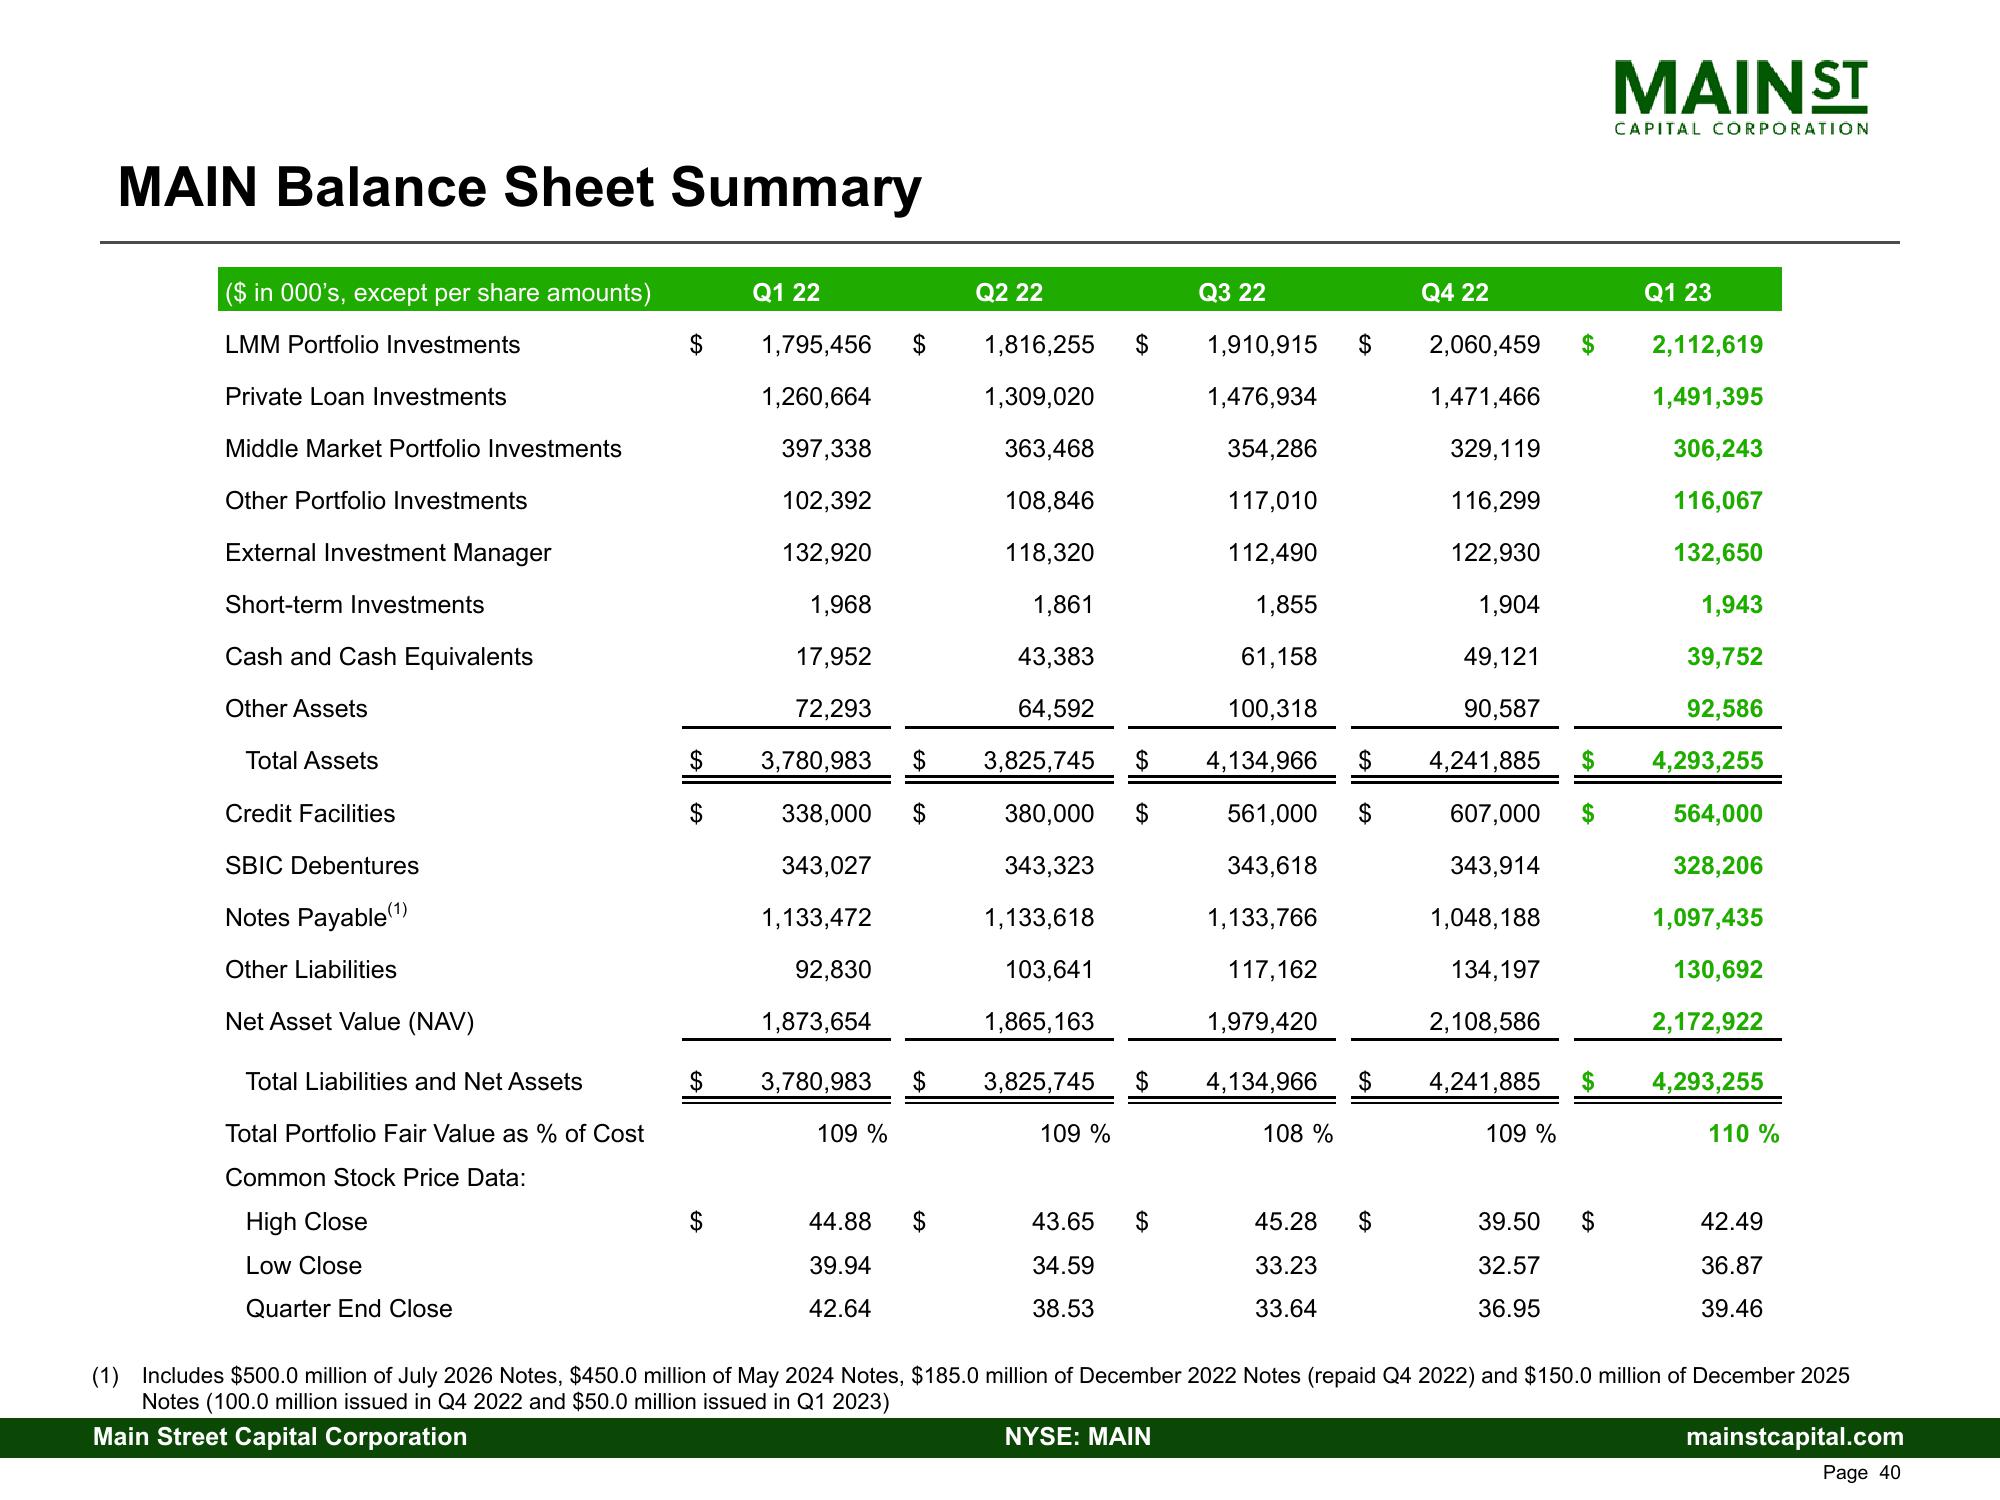
MAIN Balance Sheet Summary
($ in 000's, except per share amounts)
LMM Portfolio Investments
Private Loan Investments
Middle Market Portfolio Investments
Other Portfolio Investments
External Investment Manager
Short-term Investments
Cash and Cash Equivalents
Other Assets
Total Assets
Credit Facilities
SBIC Debentures
Notes Payable(¹)
Other Liabilities
Net Asset Value (NAV)
Total Liabilities and Net Assets
Total Portfolio Fair Value as % of Cost
Common Stock Price Data:
High Close
Low Close
Quarter End Close
$
$
$
$
$
Q1 22
1,795,456
1,260,664
397,338
102,392
132,920
1,968
17,952
72,293
3,780,983
338,000
343,027
1,133,472
92,830
1,873,654
3,780,983
109 %
44.88
39.94
42.64
$
$
$
$
Q2 22
1,816,255 $
1,309,020
363,468
108,846
118,320
1,861
43,383
64,592
3,825,745 $
380,000 $
343,323
1,133,618
103,641
1,865,163
3,825,745 $
109 %
43.65
34.59
38.53
$
Q3 22
NYSE: MAIN
1,910,915
1,476,934
354,286
117,010
112,490
1,855
61,158
100,318
4,134,966
561,000
343,618
1,133,766
117,162
1,979,420
108 %
Q4 22
2,060,459
1,471,466
329,119
116,299
122,930
1,904
49,121
90,587
$ 4,241,885
607,000
343,914
1,048,188
134,197
2,108,586
4,134,966 $
45.28
33.23
33.64
$
$
4,241,885
109 %
39.50
32.57
36.95
$
$
MAINST
CAPITAL CORPORATION
Q1 23
2,112,619
1,491,395
306,243
116,067
132,650
1,943
39,752
92,586
4,293,255
564,000
328,206
1,097,435
130,692
2,172,922
4,293,255
110%
42.49
36.87
39.46
(1) Includes $500.0 million of July 2026 Notes, $450.0 million of May 2024 Notes, $185.0 million of December 2022 Notes (repaid Q4 2022) and $150.0 million of December 2025
Notes (100.0 million issued in Q4 2022 and $50.0 million issued in Q1 2023)
Main Street Capital Corporation
mainstcapital.com
Page 40View entire presentation