Paysafe Results Presentation Deck
Underlying growth, excl. direct marketing impact
Direct marketing vertical improves sequentially; YoY headwind moderating in 2H
YTD Revenue $m
Direct Marketing (¹)
Other Revenue
YTD Adj. EBITDA $m
Direct Marketing (¹)
Other Revenue
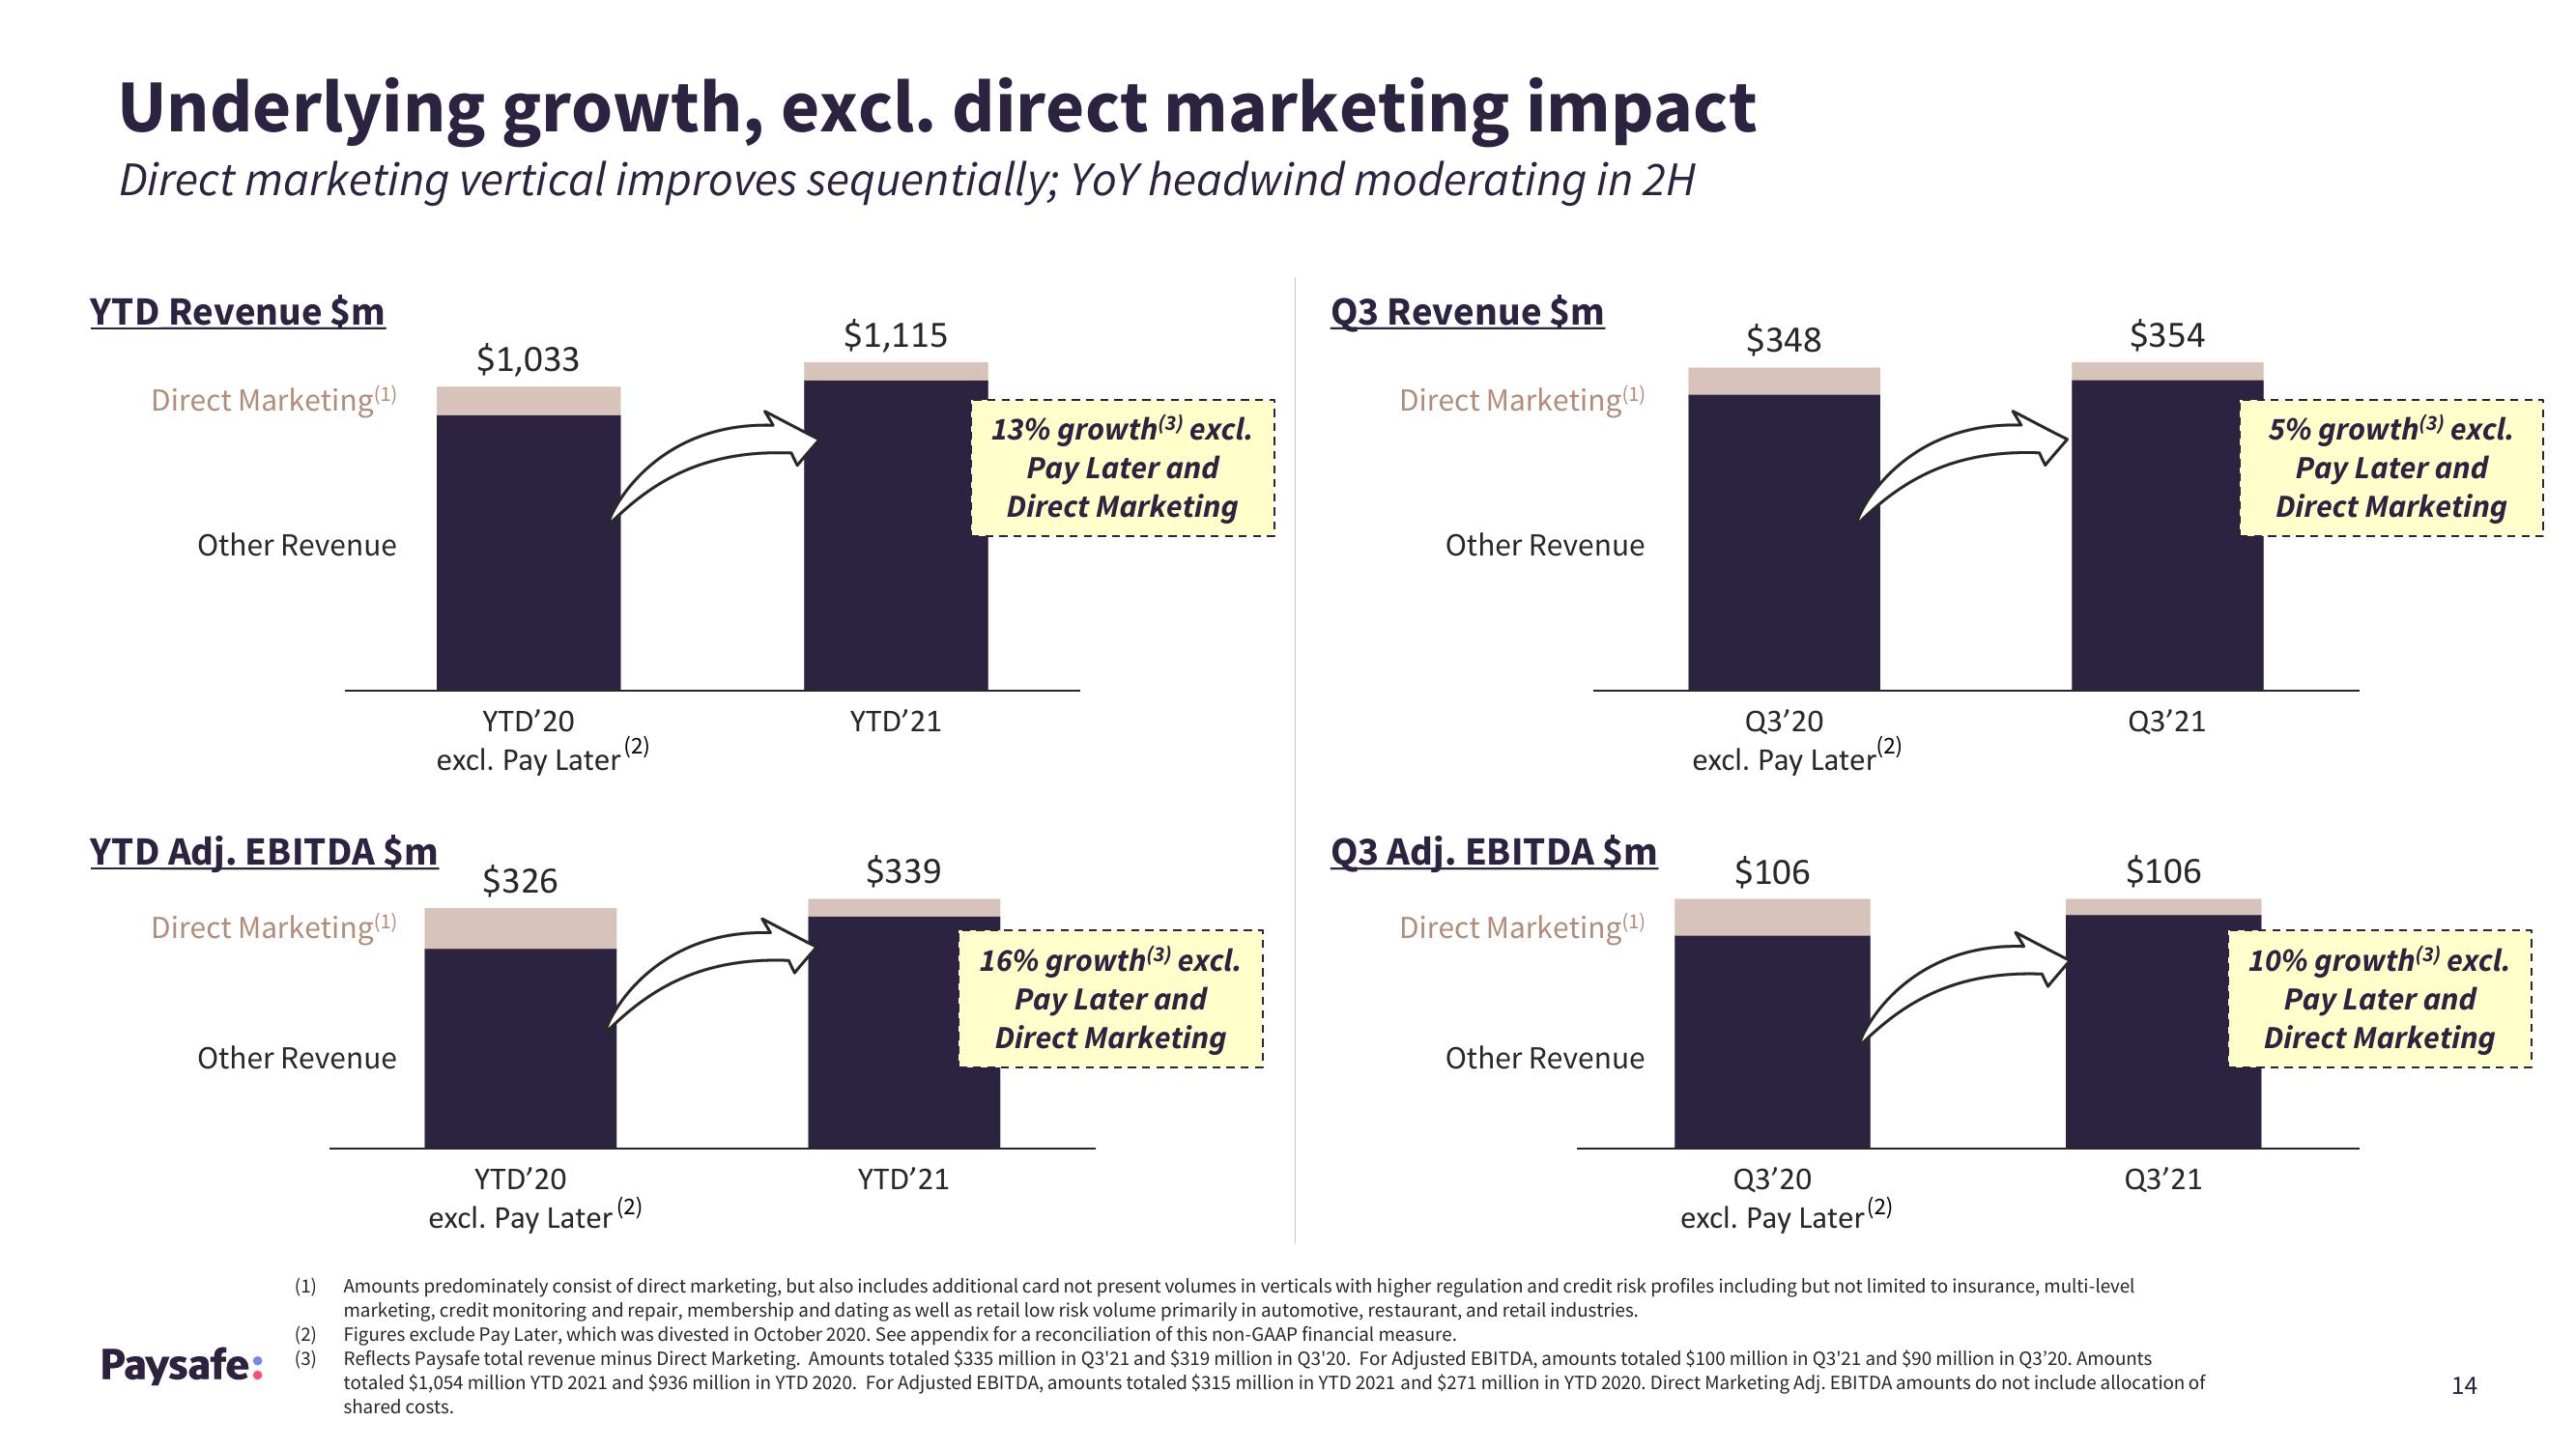
$1,033
YTD'20
excl. Pay Later (2)
Paysafe: (3)
$326
YTD'20
excl. Pay Later
(2)
$1,115
YTD'21
$339
YTD'21
13% growth(3) excl.
Pay Later and
Direct Marketing
16% growth(3) excl.
Pay Later and
Direct Marketing
Q3 Revenue $m
Direct Marketing (¹)
Other Revenue
Q3 Adj. EBITDA $m
Direct Marketing (¹)
Other Revenue
$348
Q3'20
excl. Pay Later(2)
$106
Q3'20
excl. Pay Later (2)
$354
Q3'21
$106
Q3'21
(1)
Amounts predominately consist of direct marketing, but also includes additional card not present volumes in verticals with higher regulation and credit risk profiles including but not limited to insurance, multi-level
marketing, credit monitoring and repair, membership and dating as well as retail low risk volume primarily in automotive, restaurant, and retail industries.
(2) Figures exclude Pay Later, which was divested in October 2020. See appendix for a reconciliation of this non-GAAP financial measure.
Reflects Paysafe total revenue minus Direct Marketing. Amounts totaled $335 million in Q3'21 and $319 million in Q3'20. For Adjusted EBITDA, amounts totaled $100 million in Q3'21 and $90 million in Q3'20. Amounts
totaled $1,054 million YTD 2021 and $936 million in YTD 2020. For Adjusted EBITDA, amounts totaled $315 million in YTD 2021 and $271 million in YTD 2020. Direct Marketing Adj. EBITDA amounts do not include allocation of
shared costs.
5% growth(3) excl.
Pay Later and
Direct Marketing
10% growth(3) excl.
Pay Later and
Direct Marketing
14View entire presentation