Fiscal Second Quarter 2023 Financial Results
Fiscal Second Quarter 2023 Results and Other Highlights
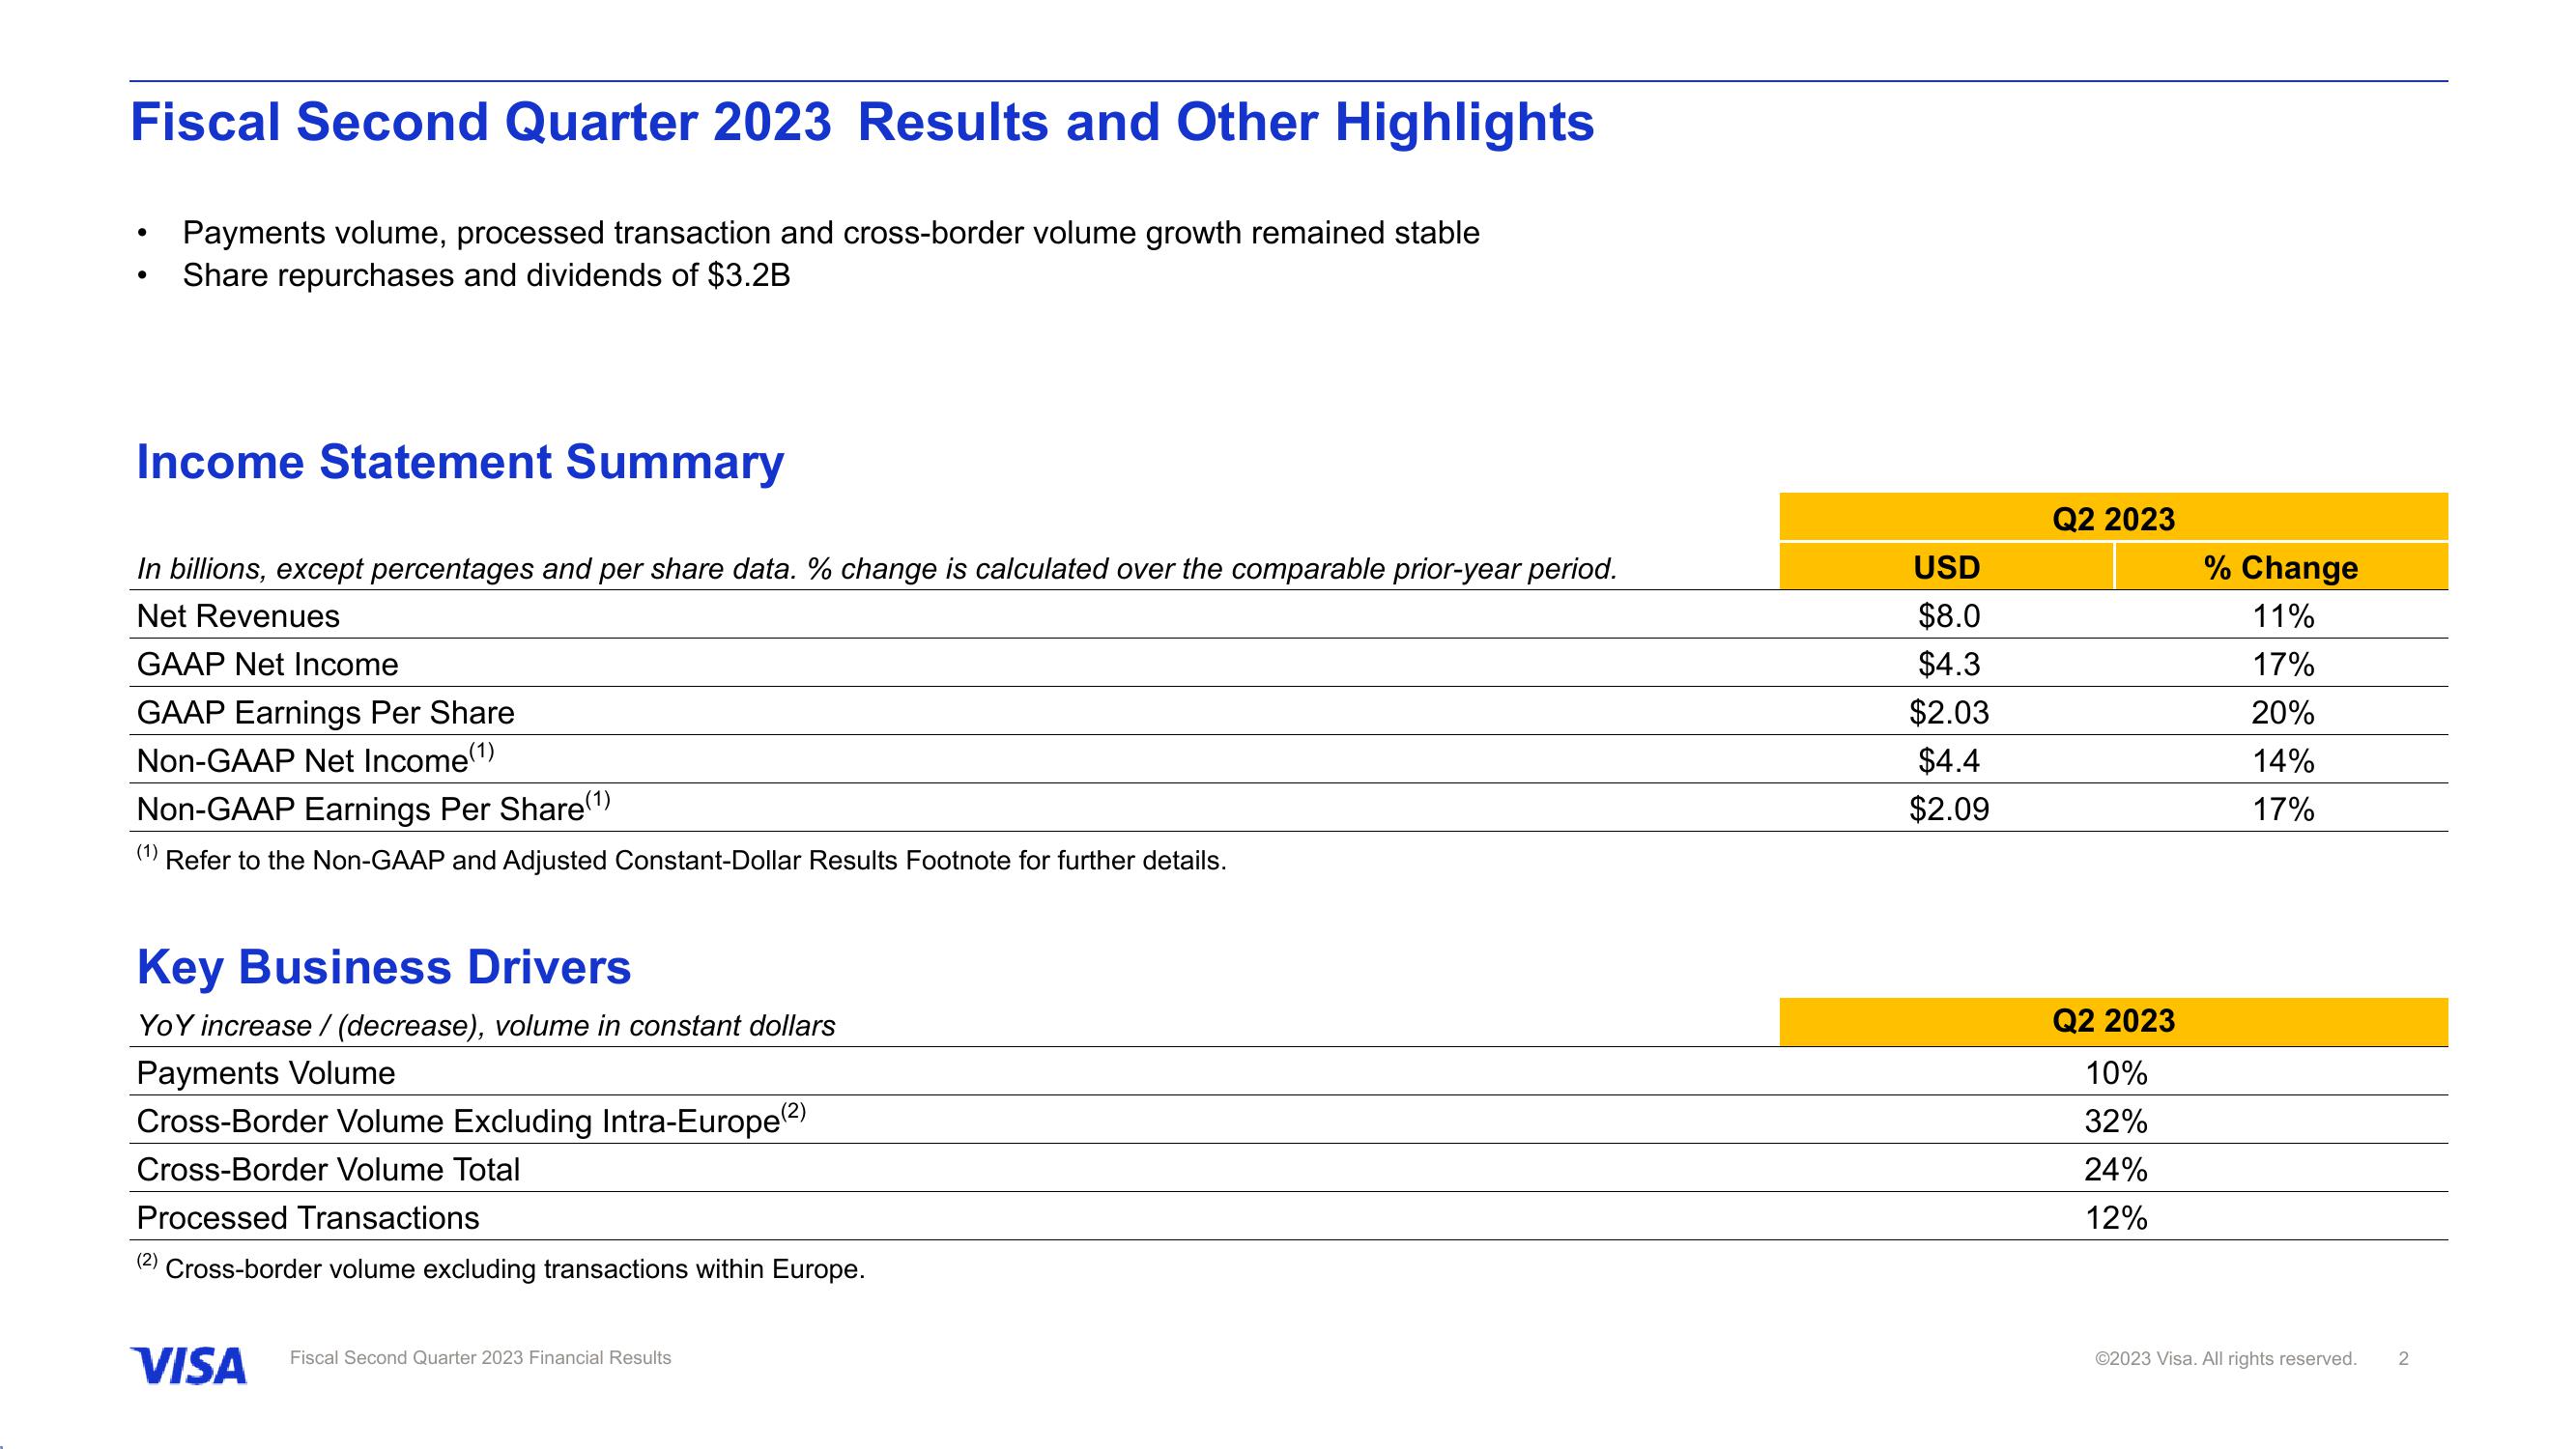
Payments volume, processed transaction and cross-border volume growth remained stable
Share repurchases and dividends of $3.2B
●
Income Statement Summary
In billions, except percentages and per share data. % change is calculated over the comparable prior-year period.
Net Revenues
GAAP Net Income
GAAP Earnings Per Share
Non-GAAP Net Income(¹)
Non-GAAP Earnings Per Share(¹)
(1) Refer to the Non-GAAP and Adjusted Constant-Dollar Results Footnote for further details.
Key Business Drivers
YoY increase / (decrease), volume in constant dollars
Payments Volume
Cross-Border Volume Excluding Intra-Europe (²)
Cross-Border Volume Total
Processed Transactions
(2) Cross-border volume excluding transactions within Europe.
VISA
Fiscal Second Quarter 2023 Financial Results
USD
$8.0
$4.3
$2.03
$4.4
$2.09
Q2 2023
Q2 2023
10%
32%
24%
12%
% Change
11%
17%
20%
14%
17%
Ⓒ2023 Visa. All rights reserved.
2View entire presentation