Pershing Square Activist Presentation Deck
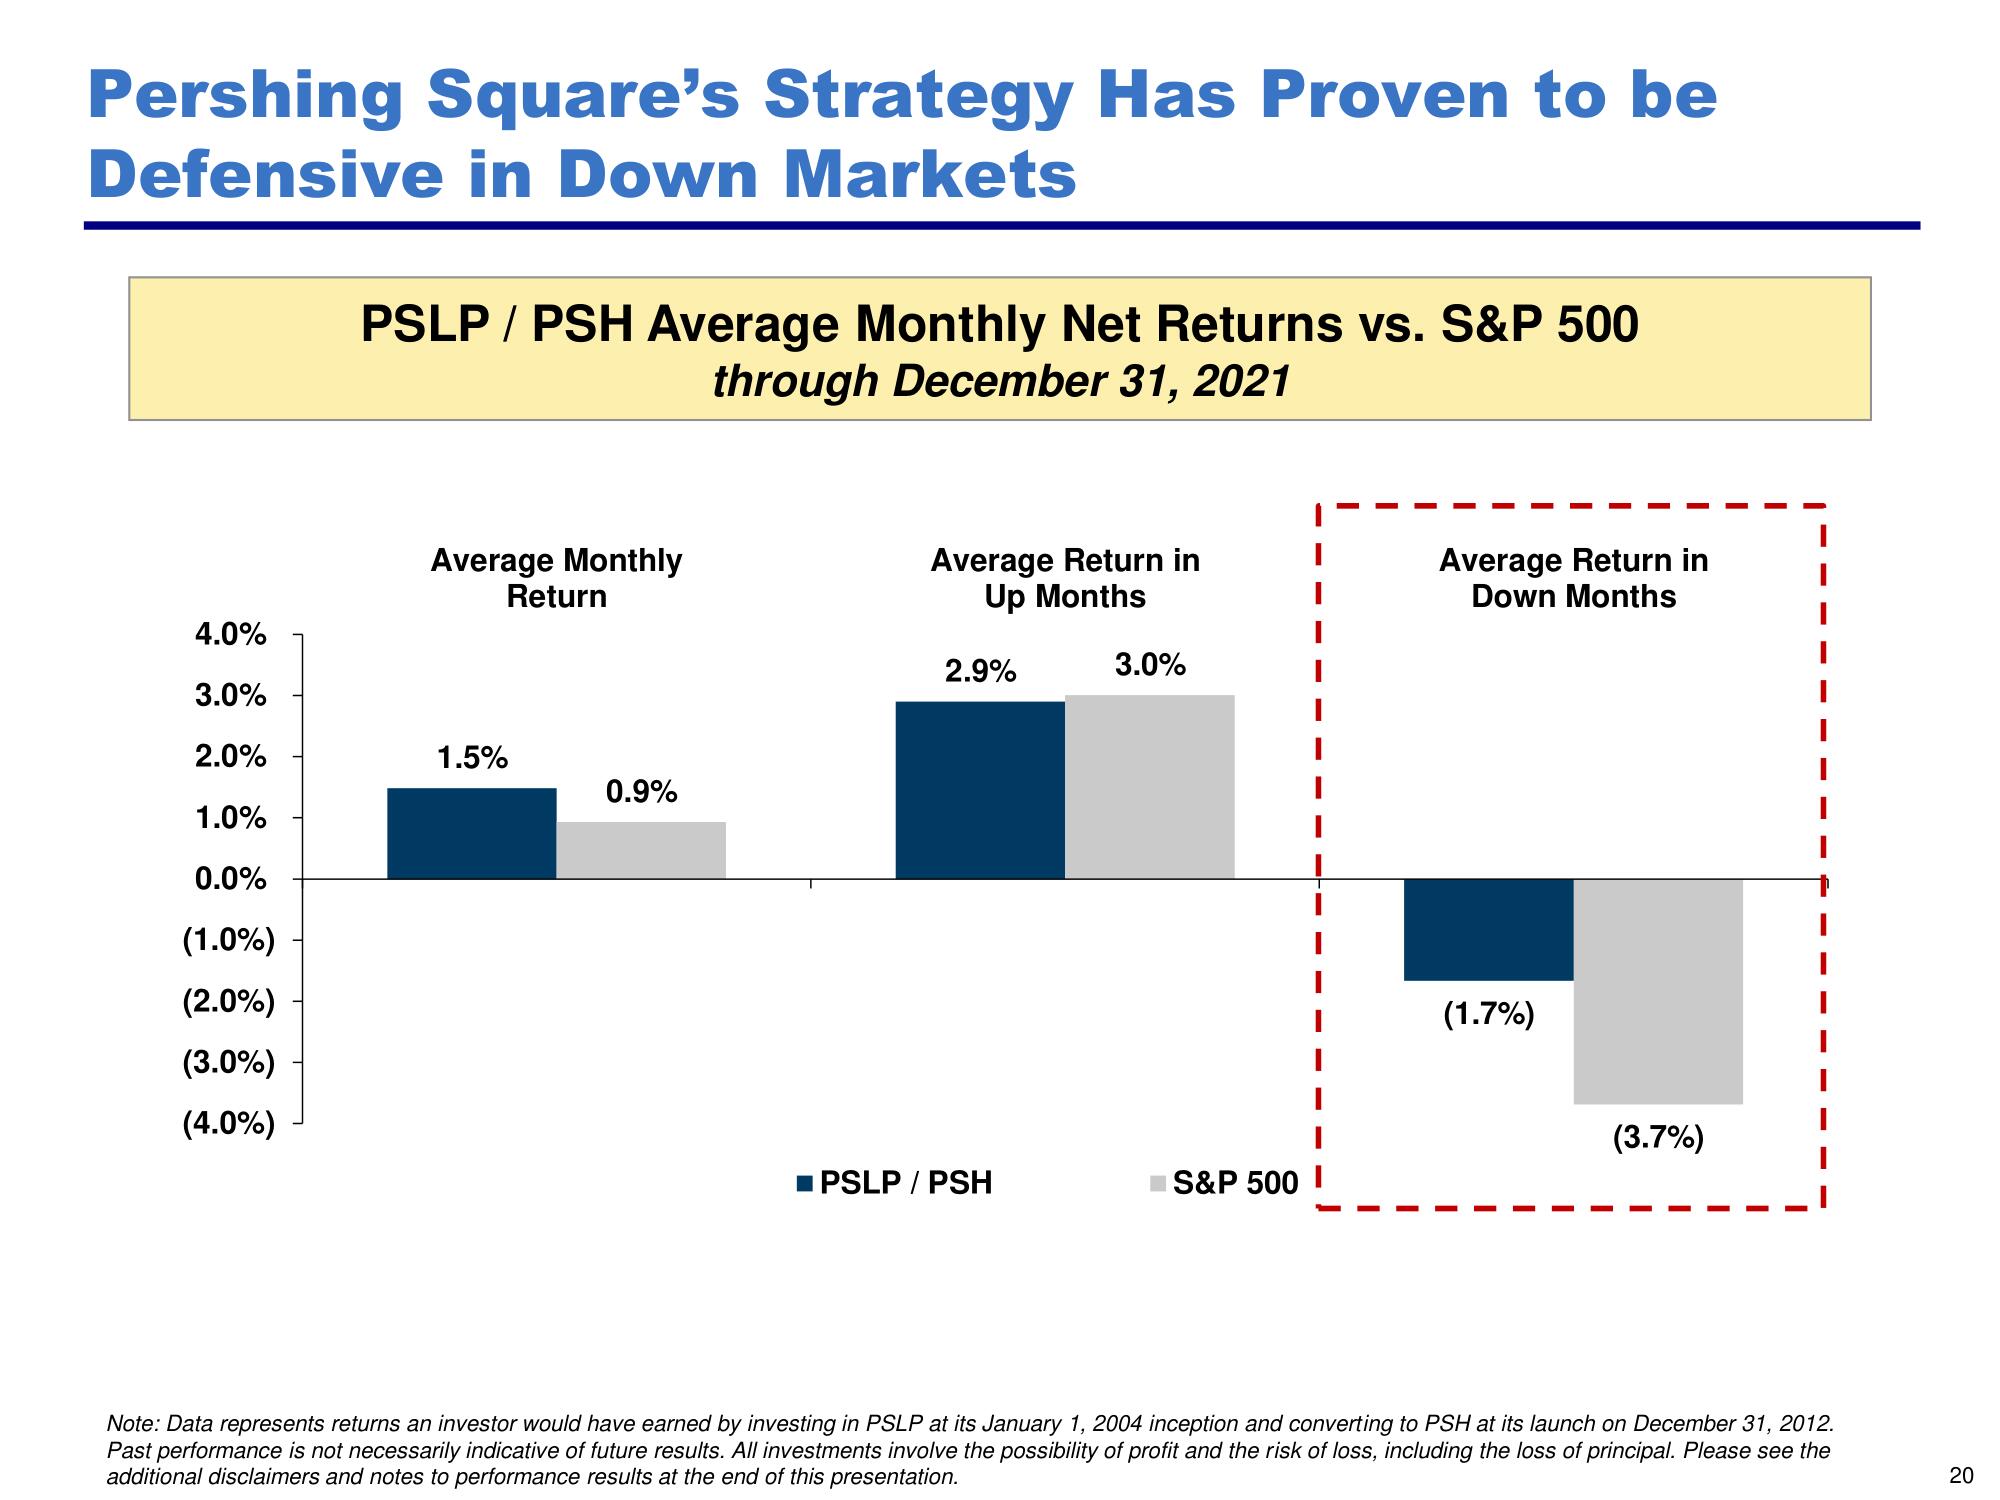
Pershing Square's Strategy Has Proven to be
Defensive in Down Markets
4.0%
3.0%
2.0%
1.0%
0.0%
(1.0%)
(2.0%)
(3.0%)
(4.0%)
PSLP / PSH Average Monthly Net Returns vs. S&P 500
through December 31, 2021
Average Monthly
1.5%
Return
0.9%
Average Return in
Up Months
2.9%
PSLP / PSH
3.0%
S&P 500 I
Average Return in
Down Months
(1.7%)
(3.7%)
I
Note: Data represents returns an investor would have earned by investing in PSLP at its January 1, 2004 inception and converting to PSH at its launch on December 31, 2012.
Past performance is not necessarily indicative of future results. All investments involve the possibility of profit and the risk of loss, including the loss of principal. Please see the
additional disclaimers and notes to performance results at the end of this presentation.
20View entire presentation