Bird SPAC Presentation Deck
23K
2018A
BIRD
AVG. DEPLOYED VEHICLES
44K
38K
46% CAGR
70K
2019A 2020A 2021P
×
107K
II
2022P
2023P
$3.30
Operating metrics summary
198K
2018A
$4.04
×
$6.30
AVG. RIDES PER DEPLOYED VEHICLE PER DAY
Return to pre-COVID mean by 2023
GROSS TRANSACTION VALUE PER RIDE
2.8x
2018A
IIII
2019A
2019A 2020A 2021P
2.5x
Ride lengths normalize
$5.92 $5.88
2022P
$5.28
1.3x
2023P
1.4x
2020A
2021P
1.9x
2022P 2023P
$79M
2018A
2.4x
$162M
‒‒‒‒‒‒‒__l
||
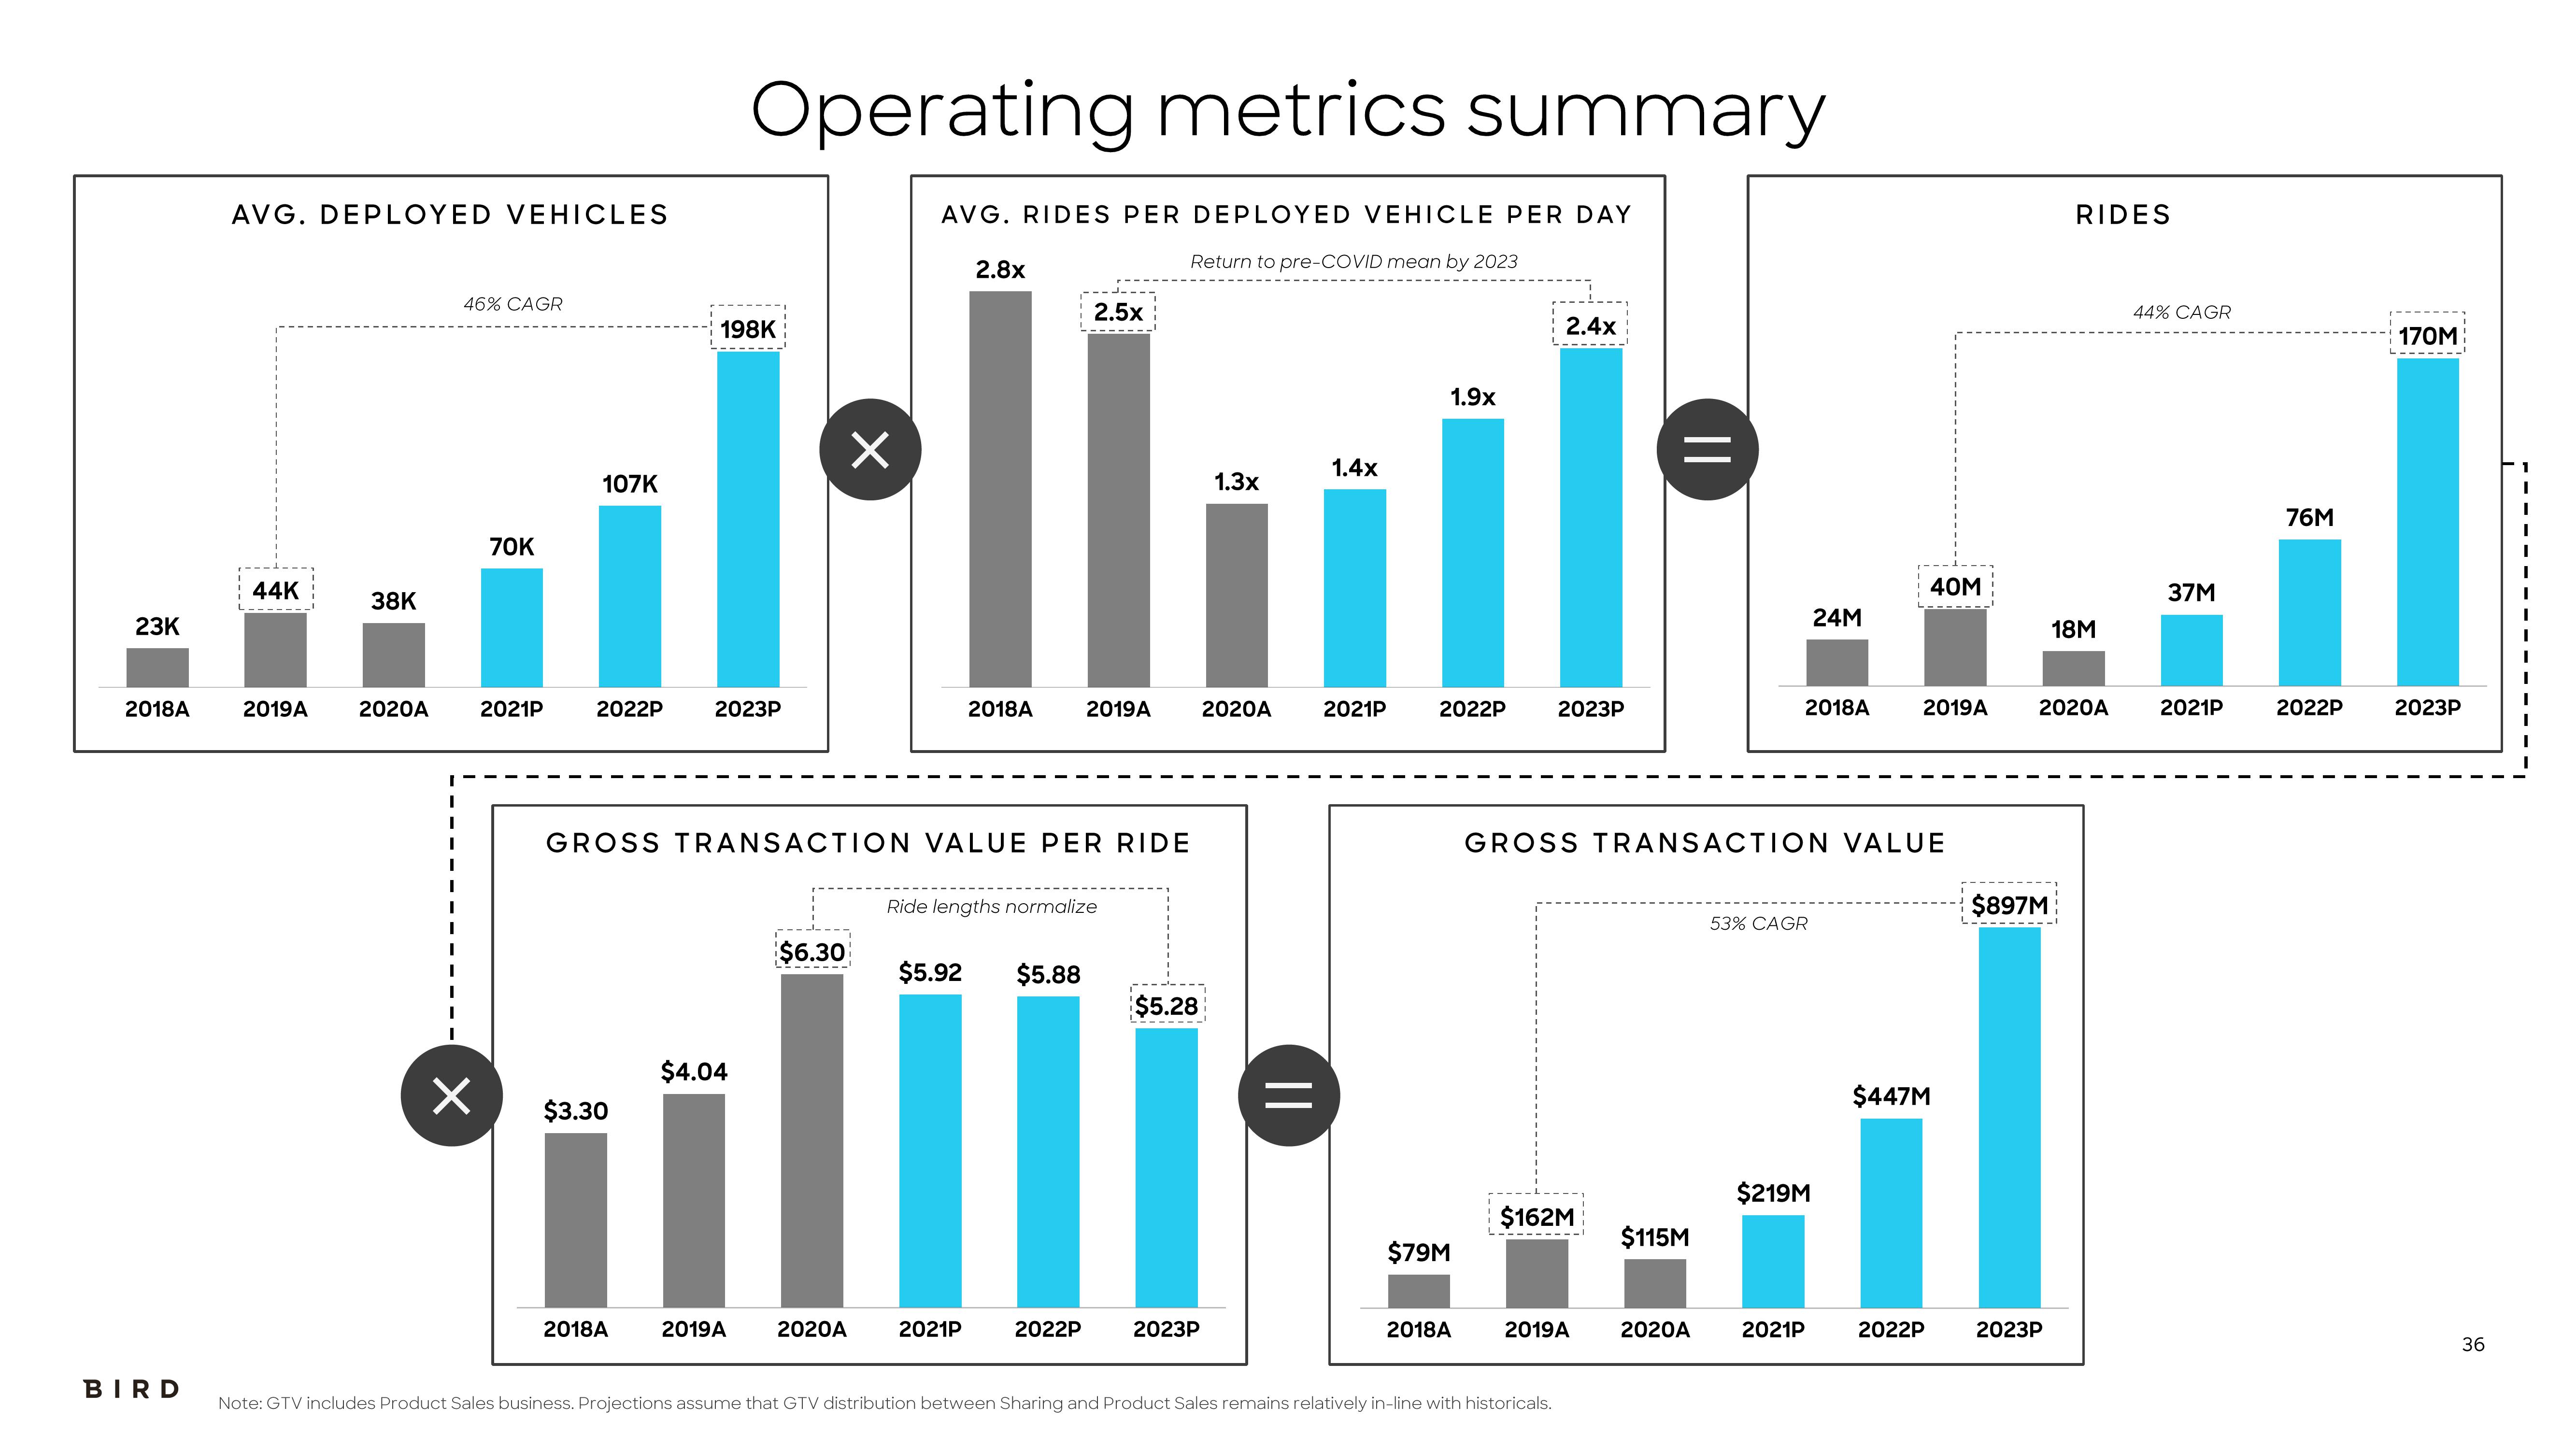
Note: GTV includes Product Sales business. Projections assume that GTV distribution between Sharing and Product Sales remains relatively in-line with historicals.
GROSS TRANSACTION VALUE
$115M
53% CAGR
2019A 2020A 2021P
24M
2018A 2019A
$219M
40M
$447M
2022P
$897M
RIDES
2020A
2023P
18M
44% CAGR
37M
2021P
76M
2022P
170M
2023P
36View entire presentation