Pershing Square Activist Presentation Deck
B. PF McDonald's Financial Analysis
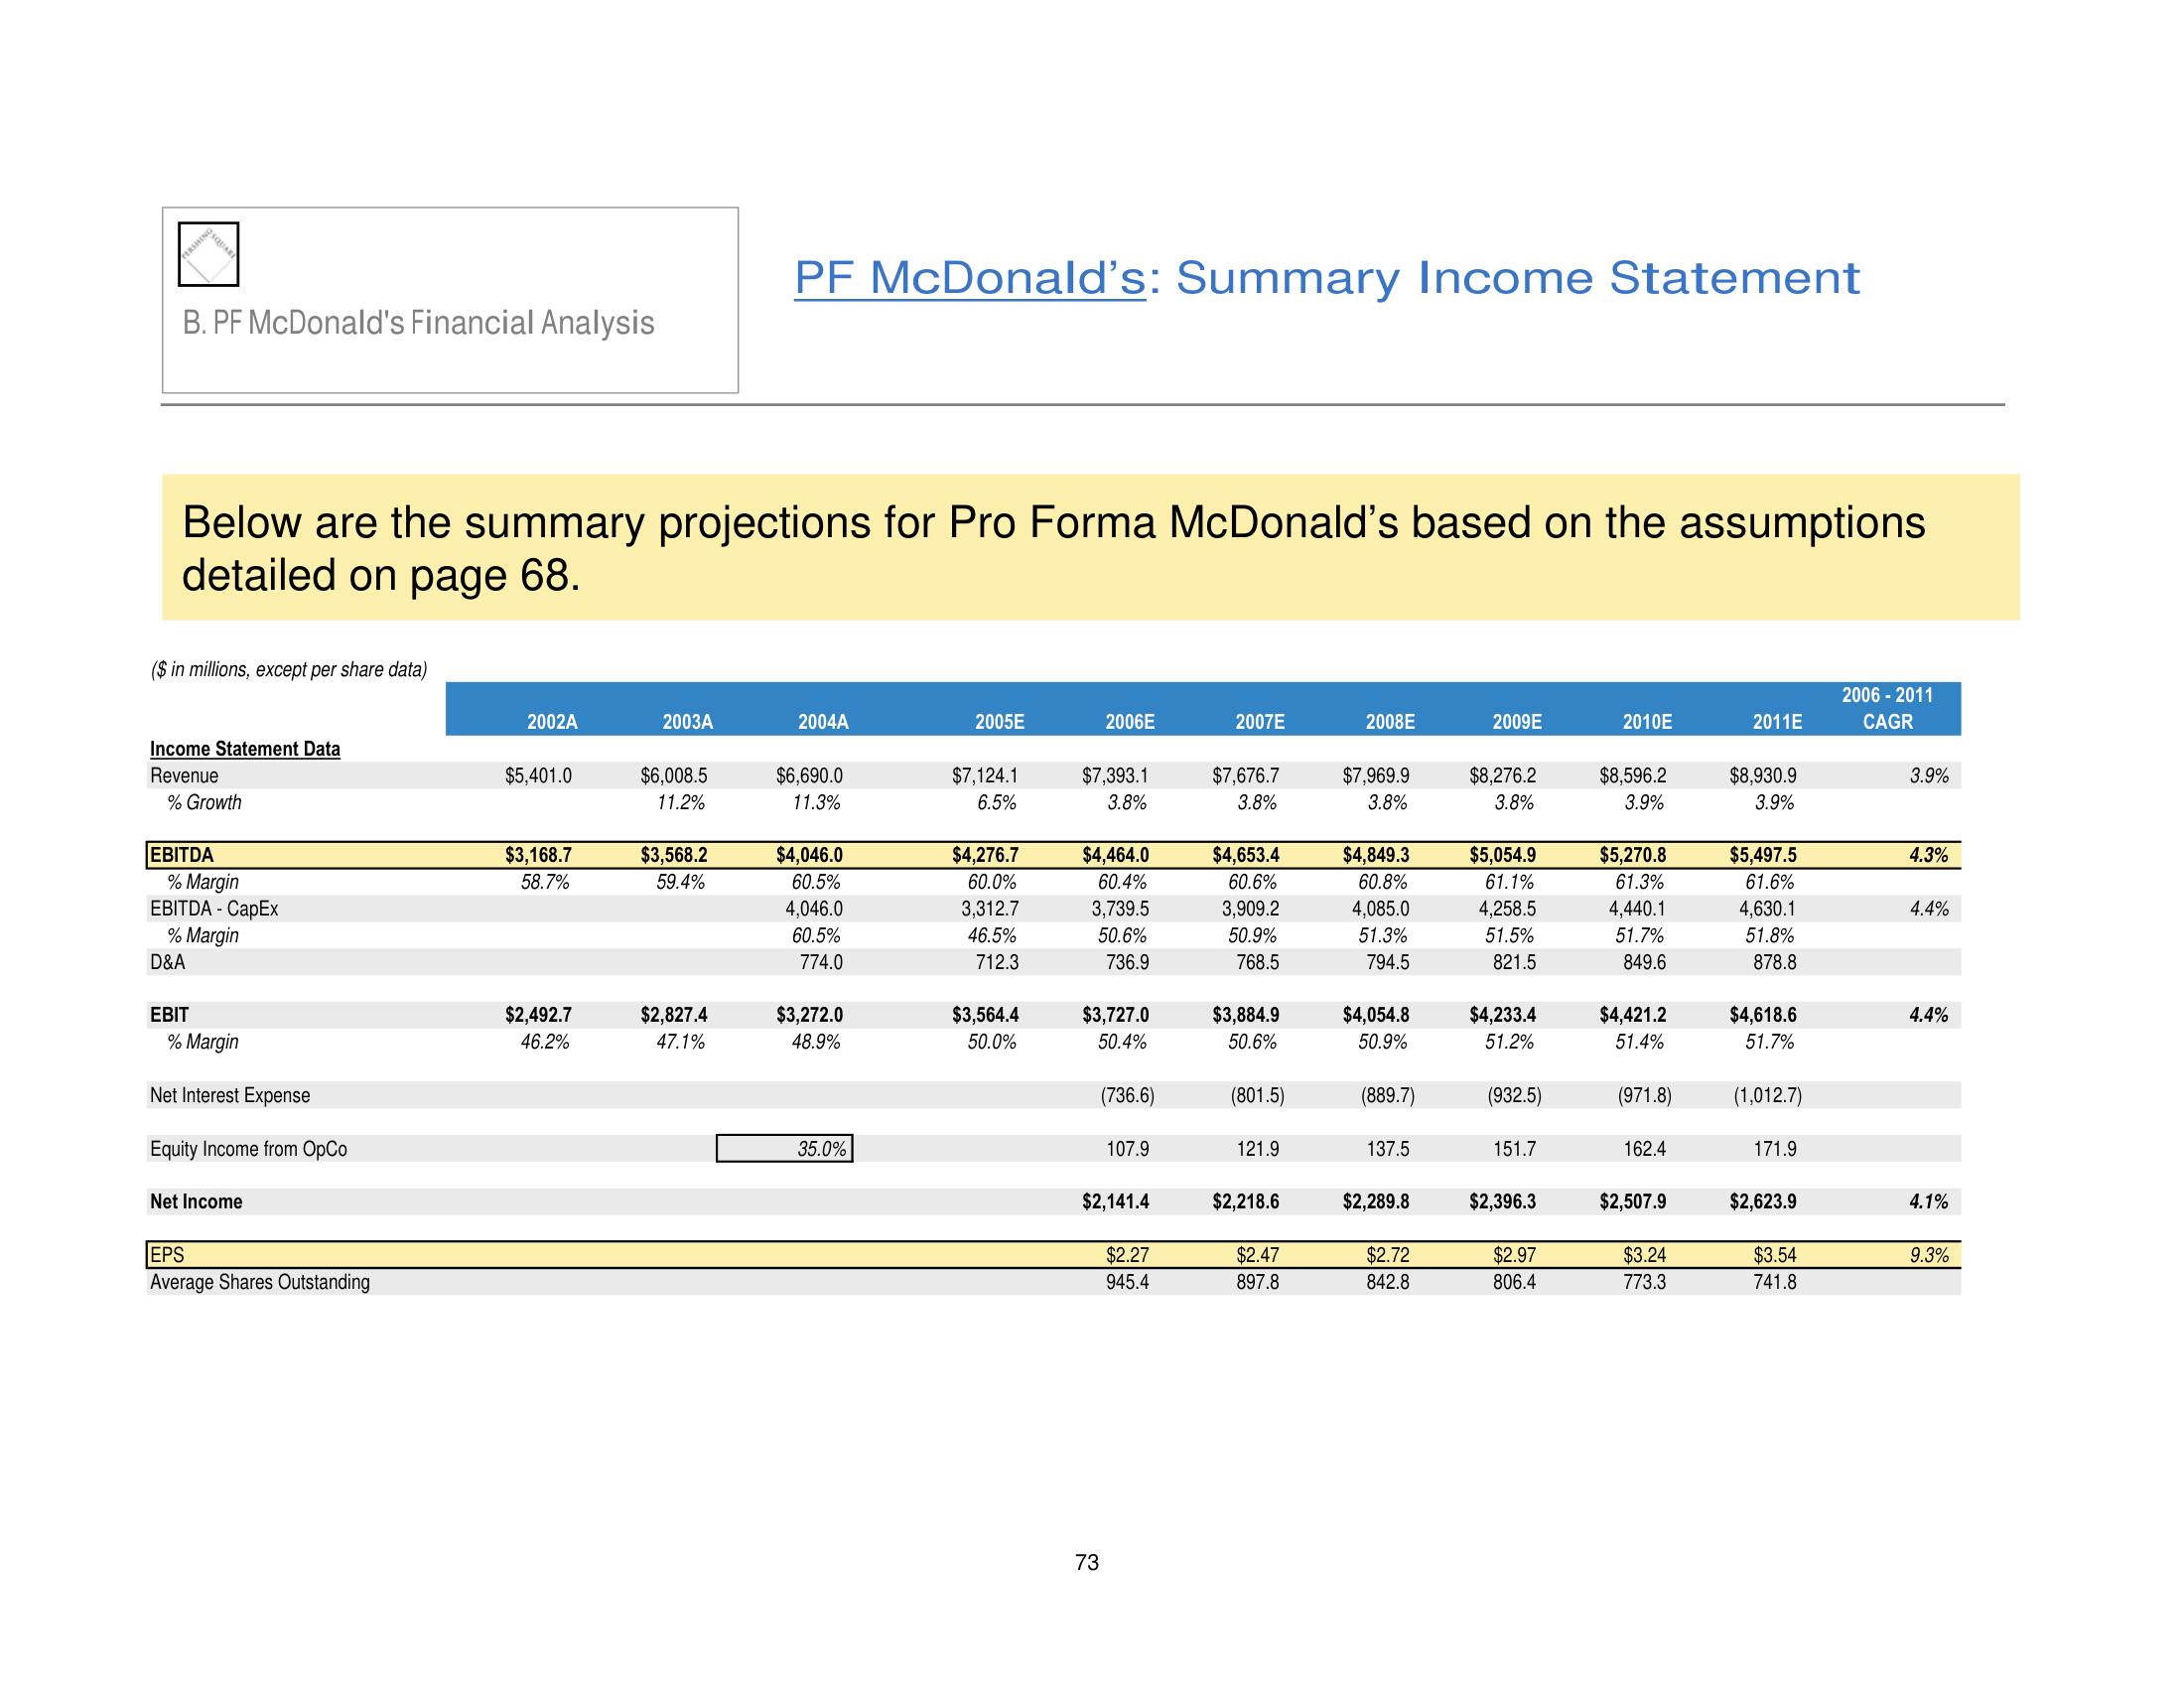
Below are the summary projections for Pro Forma McDonald's based on the assumptions
detailed on page 68.
($ in millions, except per share data)
Income Statement Data
Revenue
% Growth
EBITDA
% Margin
EBITDA - CapEx
% Margin
D&A
EBIT
% Margin
Net Interest Expense
Equity Income from OpCo
Net Income
EPS
Average Shares Outstanding
2002A
$5,401.0
$3,168.7
58.7%
$2,492.7
46.2%
2003A
$6,008.5
11.2%
$3,568.2
59.4%
PF McDonald's: Summary Income Statement
$2,827.4
47.1%
2004A
$6,690.0
11.3%
$4,046.0
60.5%
4,046.0
60.5%
774.0
$3,272.0
48.9%
35.0%
2005E
$7,124.1
6.5%
$4,276.7
60.0%
3,312.7
46.5%
712.3
$3,564.4
50.0%
2006E
$7,393.1
3.8%
$4,464.0
60.4%
3,739.5
50.6%
736.9
$3,727.0
50.4%
73
(736.6)
107.9
$2,141.4
$2.27
945.4
2007E
$7,676.7
3.8%
$4,653.4
60.6%
3,909.2
50.9%
768.5
$3,884.9
50.6%
(801.5)
121.9
$2,218.6
$2.47
897.8
2008E
$7,969.9
3.8%
$4,849.3
60.8%
4,085.0
51.3%
794.5
$4,054.8
50.9%
(889.7)
137.5
$2,289.8
$2.72
842.8
2009E
$8,276.2
3.8%
$5,054.9
61.1%
4,258.5
51.5%
821.5
$4,233.4
51.2%
(932.5)
151.7
$2,396.3
$2.97
806.4
2010E
$8,596.2
3.9%
$5,270.8
61.3%
4,440.1
51.7%
849.6
$4,421.2
51.4%
(971.8)
162.4
$2,507.9
$3.24
773.3
2011E
$8,930.9
3.9%
$5,497.5
61.6%
4,630.1
51.8%
878.8
$4,618.6
51.7%
(1,012.7)
171.9
$2,623.9
$3.54
741.8
2006 - 2011
CAGR
3.9%
4.3%
4.4%
4.4%
4.1%
9.3%View entire presentation