Baird Investment Banking Pitch Book
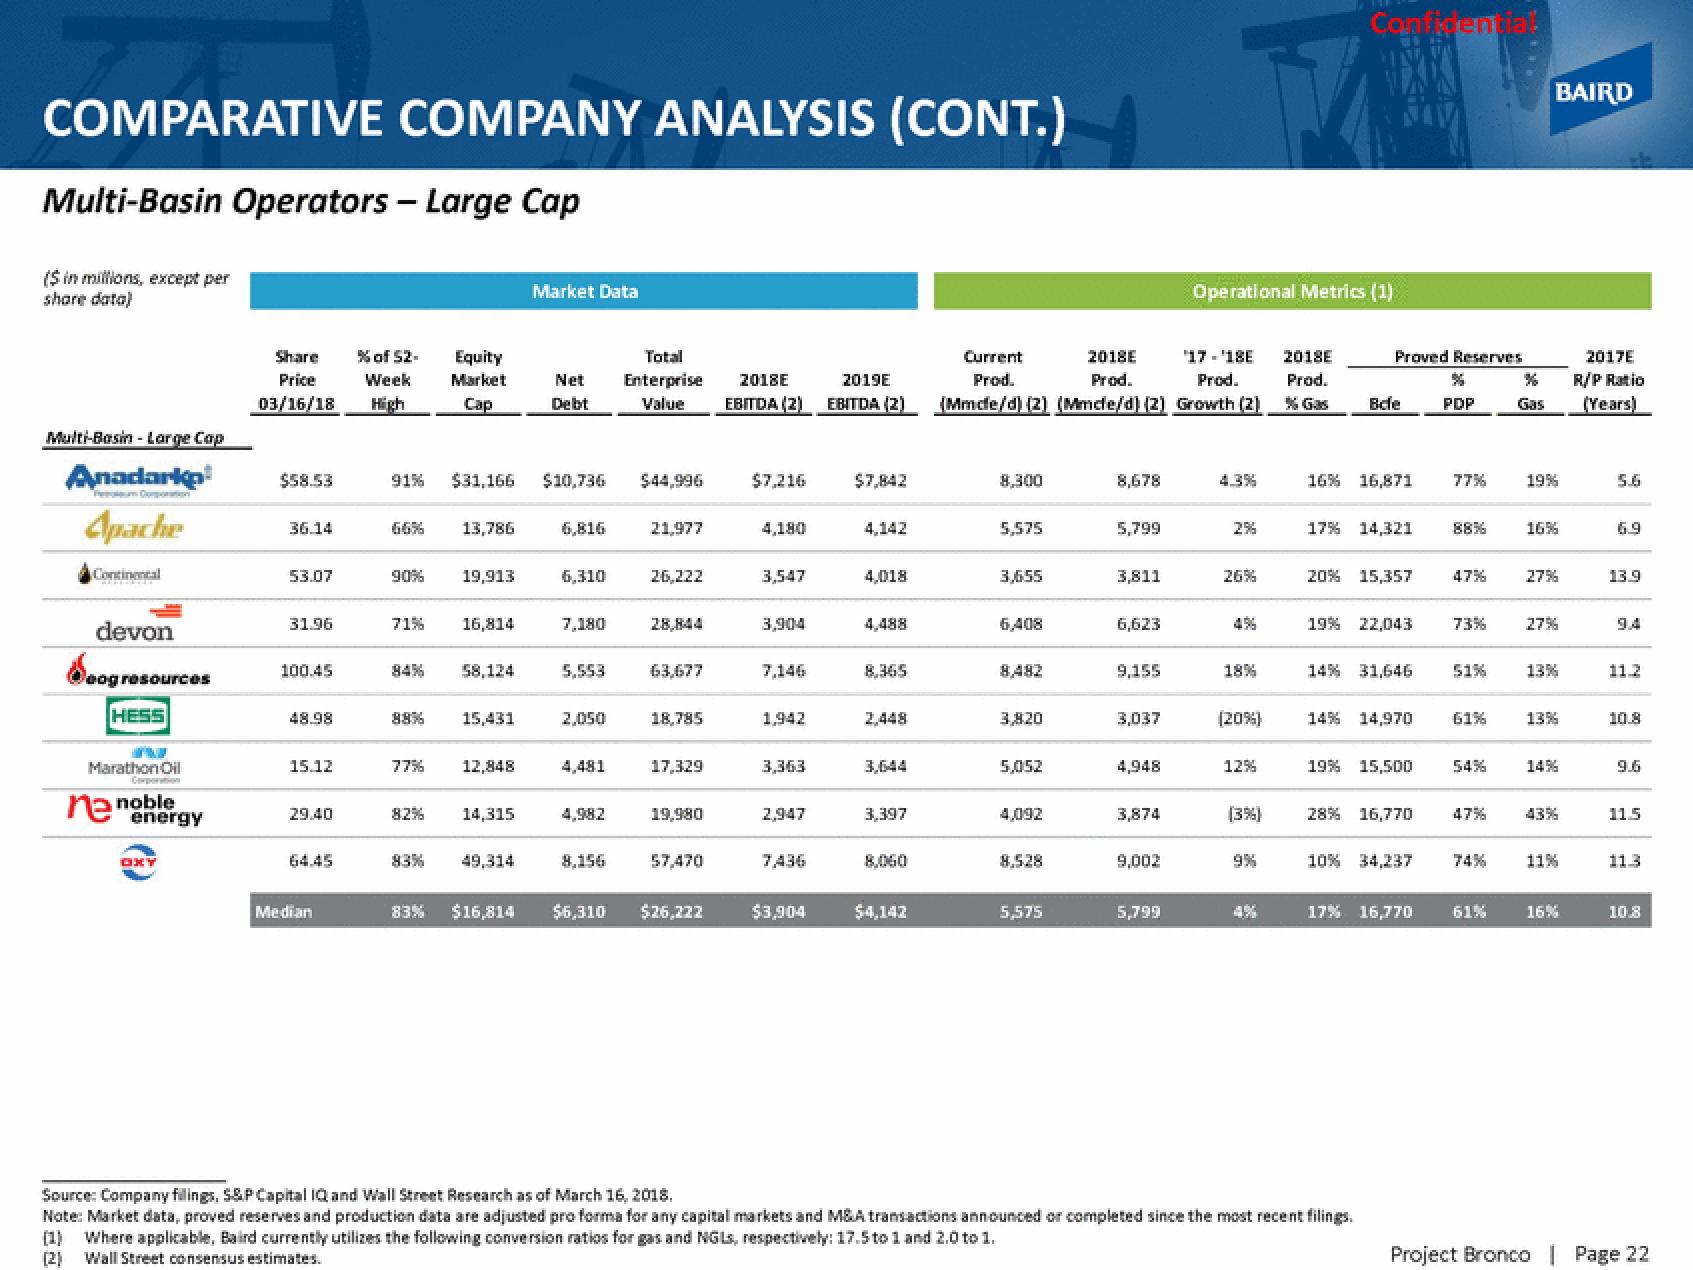
COMPARATIVE COMPANY ANALYSIS (CONT.)
Multi-Basin Operators - Large Cap
($ in millions, except per
share data)
Multi-Basin - Large Cop
Anadarko
Apache
Corporation
Continental
devon
Soogr
og resources
HESS
Marathon Oil
ne noble
energy
OX
% of 52-
Week
03/16/18 High
Share
Price
$58.53
36.14
53.07
31.96
100.45
48.98
15.12
29.40
Median
66% 13,786
90%
71%
91% $31,166 $10,736 $44,996
84%
Equity
Market
Cap
77%
82%
19,913
16,814
58,124
15,431
12,848
14,315
Market Data
83% 49,314
Net
Debt
6,816
6,310
7,180
5,553
2,050
4,481
4,982
Total
Enterprise
Value
8,156
21,977
26,222
28,844
63,677
18,785
17,329
19,980
57,470
83% $16,814 $6,310 $26,222
2018E
EBITDA (2)
$7,216
4,180
3,547
3,904
7,146
1,942
3,363
2,947
7,436
$3,904
2019E
EBITDA (2)
$7,842
4,142
4,018
4,488
8,365
2,448
3,397
8,060
$4,142
Current
2018E '17-'18E
Prod.
Prod.
Prod.
(Mmde/d) (2) (Mmde/d) (2) Growth (2)
8,300
5,575
3,655
6,408
3,820
5,052
4,092
8,528
5,575
8,678
5,799
3,811
6,623
9,155
3,037
4,948
3,874
9,002
5,799
Operational Metrics (1)
4.3%
26%
18%
(20%)
12%
(3%)
9%
2018E
Prod.
% Gas
Confidential
Proved Reserves
Bele
16% 16,871
17% 14,321
20% 15,357
19% 22,043
14% 31,646
14% 14,970
19% 15,500
28% 16,770
Source: Company filings, S&P Capital IQ and Wall Street Research as of March 16, 2018.
Note: Market data, proved reserves and production data are adjusted pro forma for any capital markets and M&A transactions announced or completed since the most recent filings.
(1) Where applicable, Baird currently utilizes the following conversion ratios for gas and NGLs, respectively: 17.5 to 1 and 2.0 to 1.
(2)
Wall Street consensus estimates.
10% 34,237
17% 16,770
%
PDP
77%
47%
73%
51%
61%
54%
74%
61%
%
Gas
BAIRD
19%
16%
27%
27%
13%
13%
14%
43%
11%
16%
2017E
R/P Ratio
(Years)
5.6
6.9
13.9
112
10.8
9.6
11.5
11.3
10.8
Project Bronco | Page 22View entire presentation