Tesla Results Presentation Deck
8
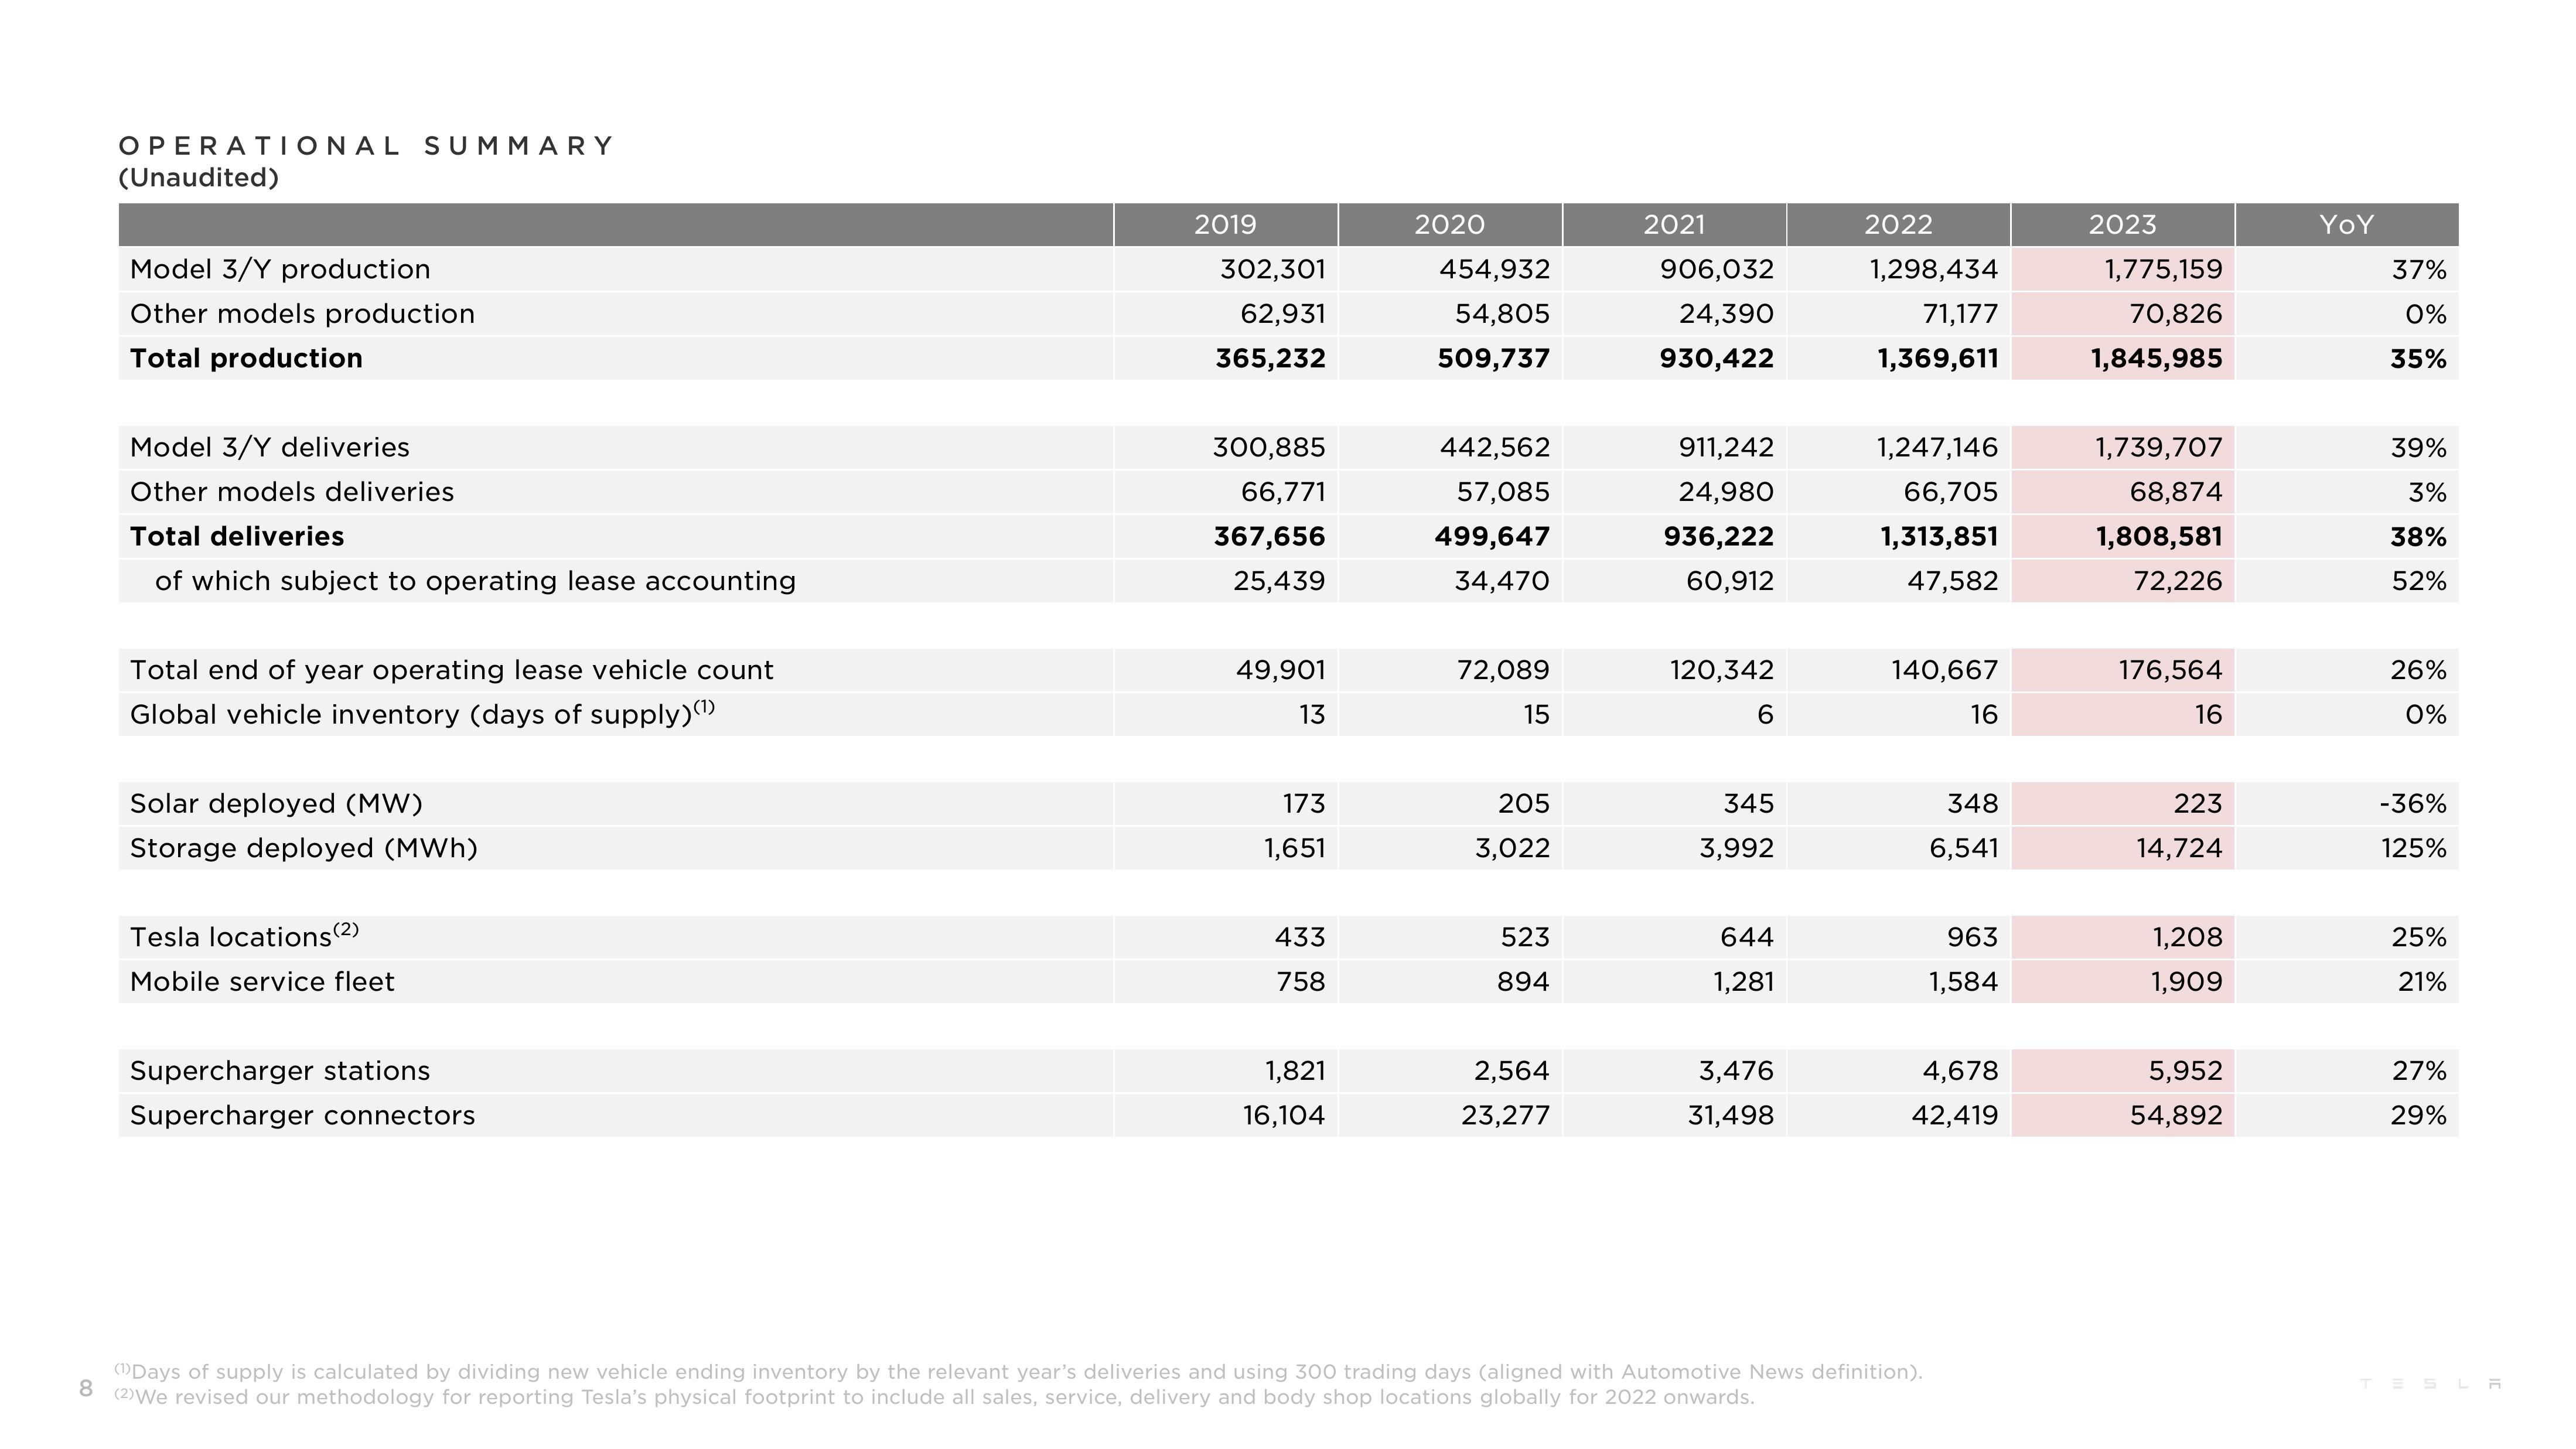
OPERATIONAL SUMMARY
(Unaudited)
Model 3/Y production
Other models production
Total production
Model 3/Y deliveries
Other models deliveries
Total deliveries
of which subject to operating lease accounting
Total end of year operating lease vehicle count
Global vehicle inventory (days of supply)(¹)
Solar deployed (MW)
Storage deployed (MWh)
Tesla locations (2)
Mobile service fleet
Supercharger stations
Supercharger connectors
2019
302,301
62,931
365,232
300,885
66,771
367,656
25,439
49,901
13
173
1,651
433
758
1,821
16,104
2020
454,932
54,805
509,737
442,562
57,085
499,647
34,470
72,089
15
205
3,022
523
894
2,564
23,277
2021
906,032
24,390
930,422
911,242
24,980
936,222
60,912
120,342
6
345
3,992
644
1,281
3,476
31,498
2022
1,298,434
71,177
1,369,611
1,247,146
66,705
1,313,851
47,582
140,667
16
(Days of supply is calculated by dividing new vehicle ending inventory by the relevant year's deliveries and using 300 trading days (aligned with Automotive News definition).
(2)We revised our methodology for reporting Tesla's physical footprint to include all sales, service, delivery and body shop locations globally for 2022 onwards.
348
6,541
963
1,584
4,678
42,419
2023
1,775,159
70,826
1,845,985
1,739,707
68,874
1,808,581
72,226
176,564
16
223
14,724
1,208
1,909
5,952
54,892
YoY
37%
0%
35%
39%
3%
38%
52%
26%
0%
-36%
125%
25%
21%
27%
29%
TESLAView entire presentation