Cboe Results Presentation Deck
Grew Recurring Non-Transactional Revenue
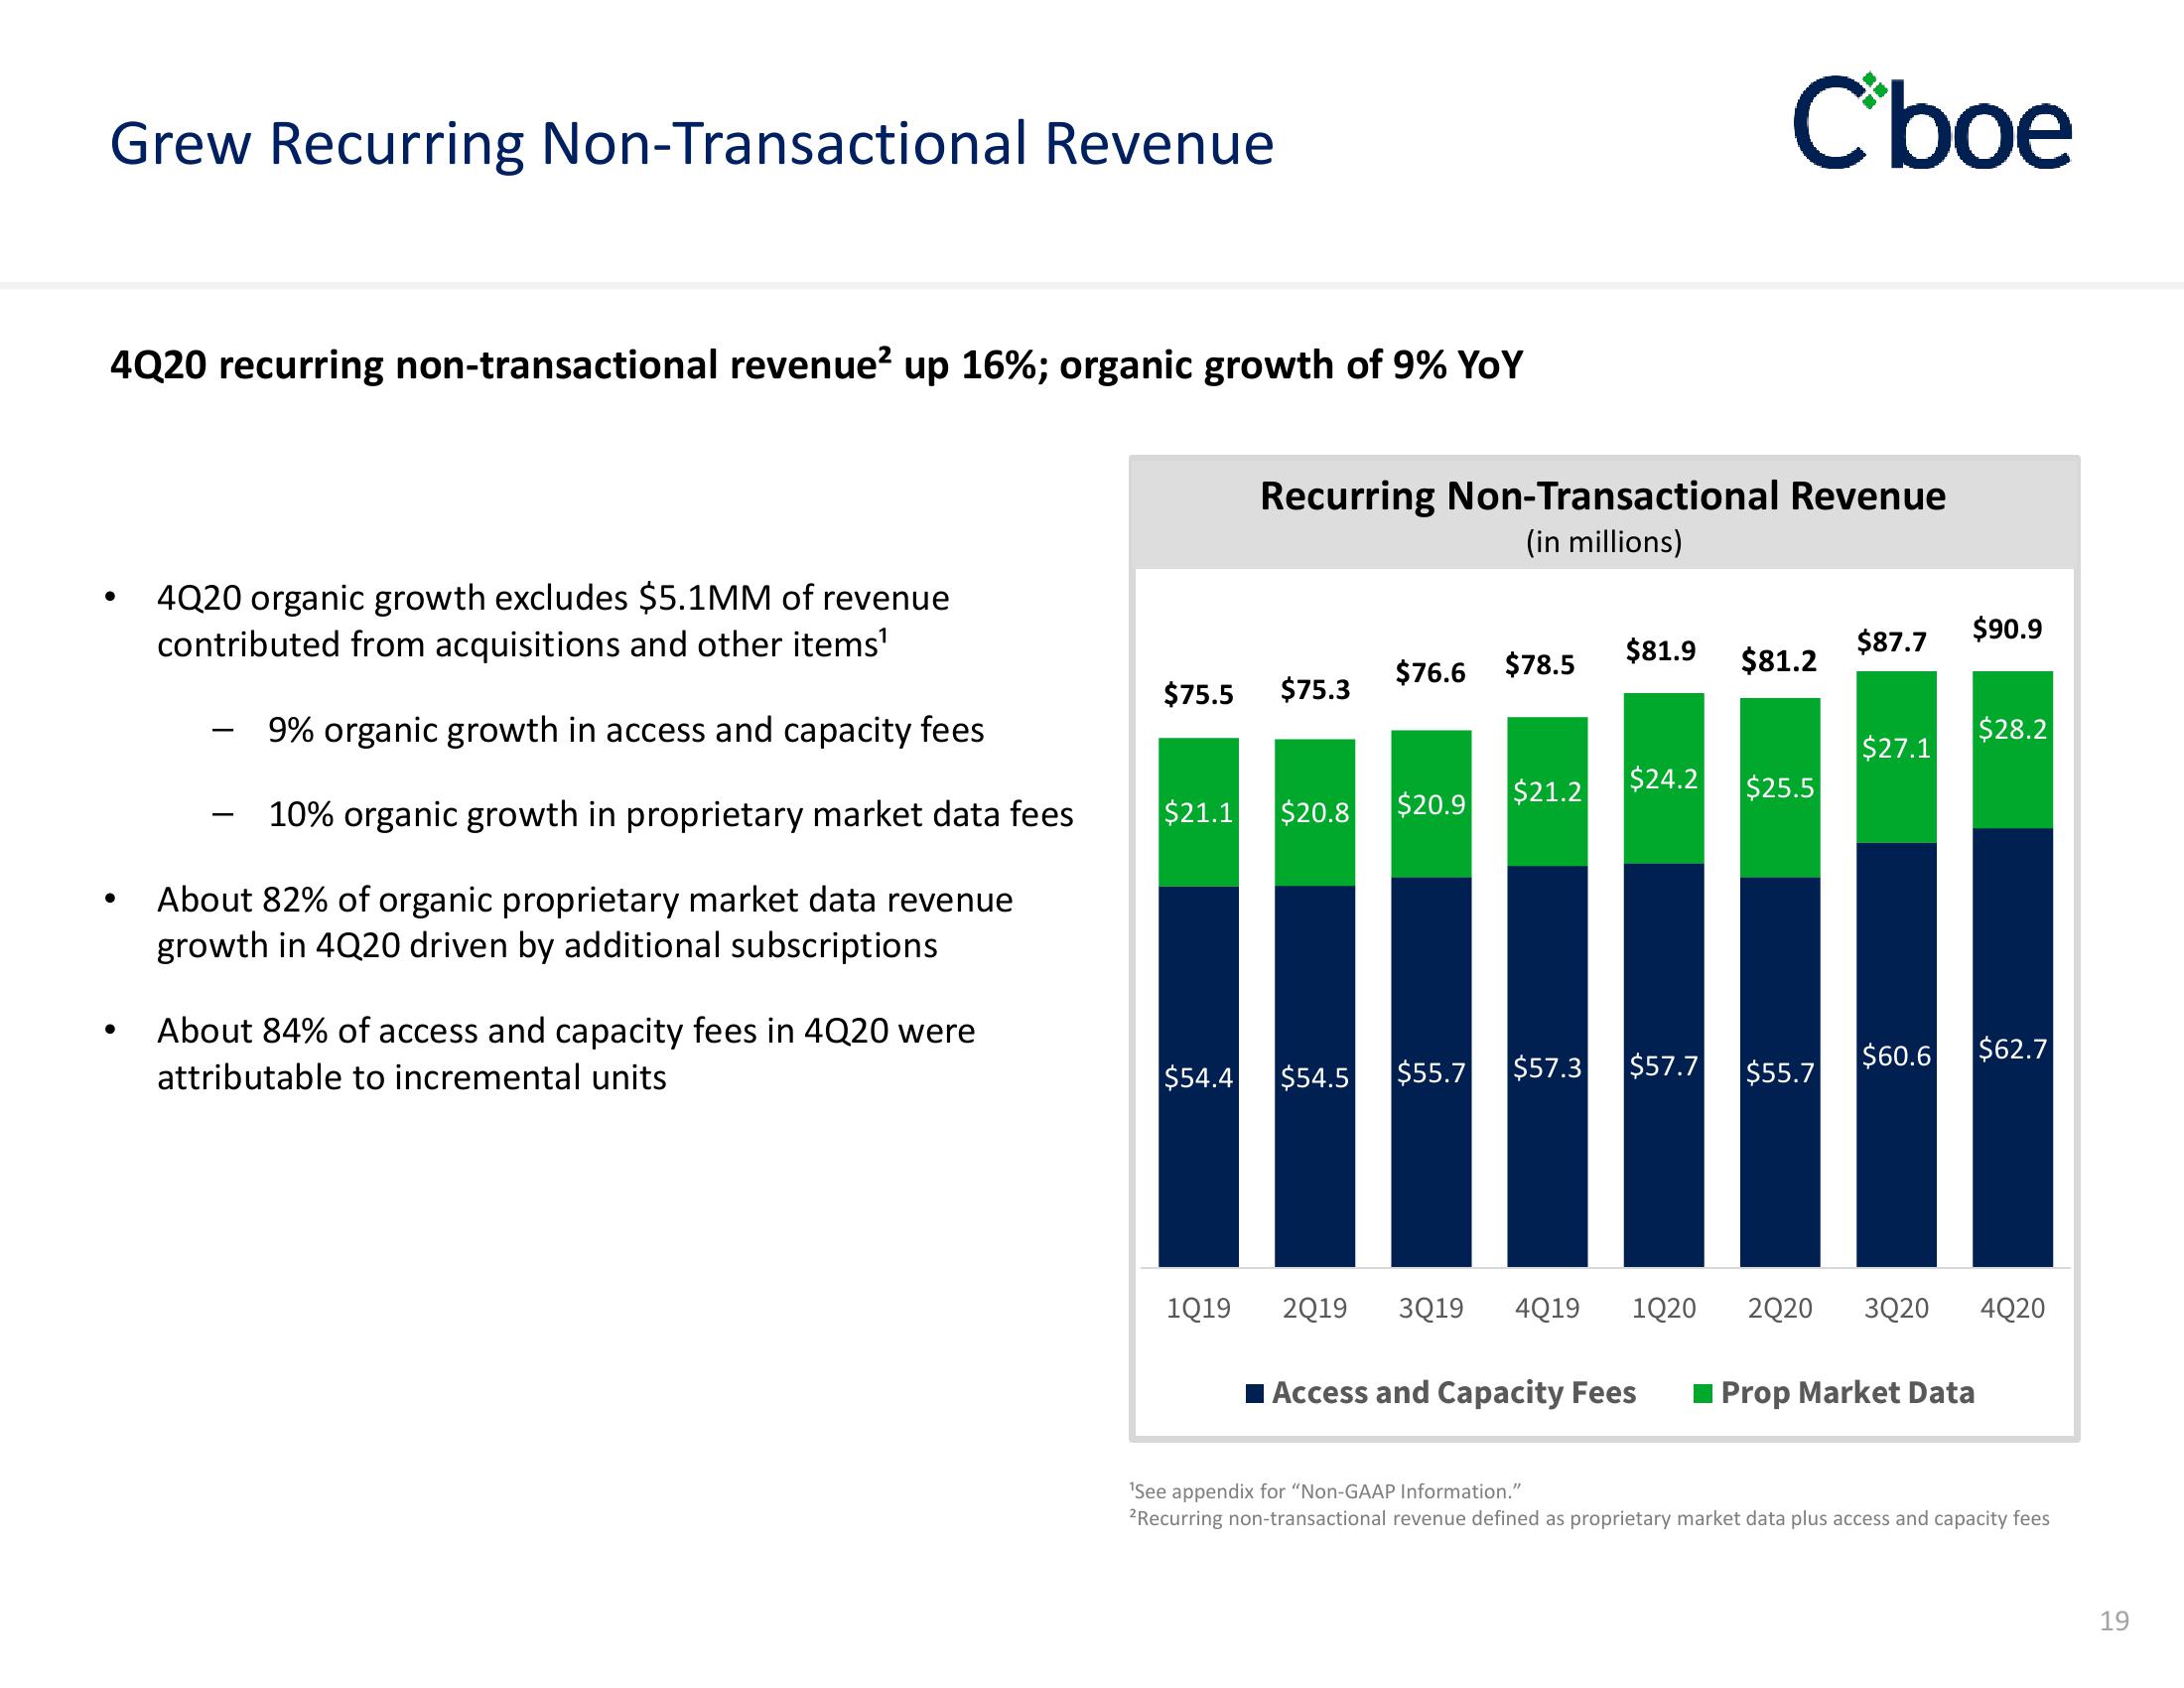
4Q20 recurring non-transactional revenue² up 16%; organic growth of 9% YoY
●
●
●
4Q20 organic growth excludes $5.1MM of revenue
contributed from acquisitions and other items¹
9% organic growth in access and capacity fees
10% organic growth in proprietary market data fees
About 82% of organic proprietary market data revenue
growth in 4Q20 driven by additional subscriptions
About 84% of access and capacity fees in 4Q20 were
attributable to incremental units
$75.5 $75.3
$54.4
Recurring Non-Transactional Revenue
(in millions)
$21.1 $20.8 $20.9
1019
$76.6 $78.5
$81.9
$54.5 $55.7 $57.3
$24.2
$21.2
$57.7
2Q19 3Q19 4Q19 1Q20
Cboe
I Access and Capacity Fees
$81.2
$25.5
$55.7
$87.7
$27.1
$90.9
$28.2
$60.6 $62.7
2020 3Q20 4Q20
Prop Market Data
¹See appendix for "Non-GAAP Information."
2Recurring non-transactional revenue defined as proprietary market data plus access and capacity fees
19View entire presentation