Spotify Results Presentation Deck
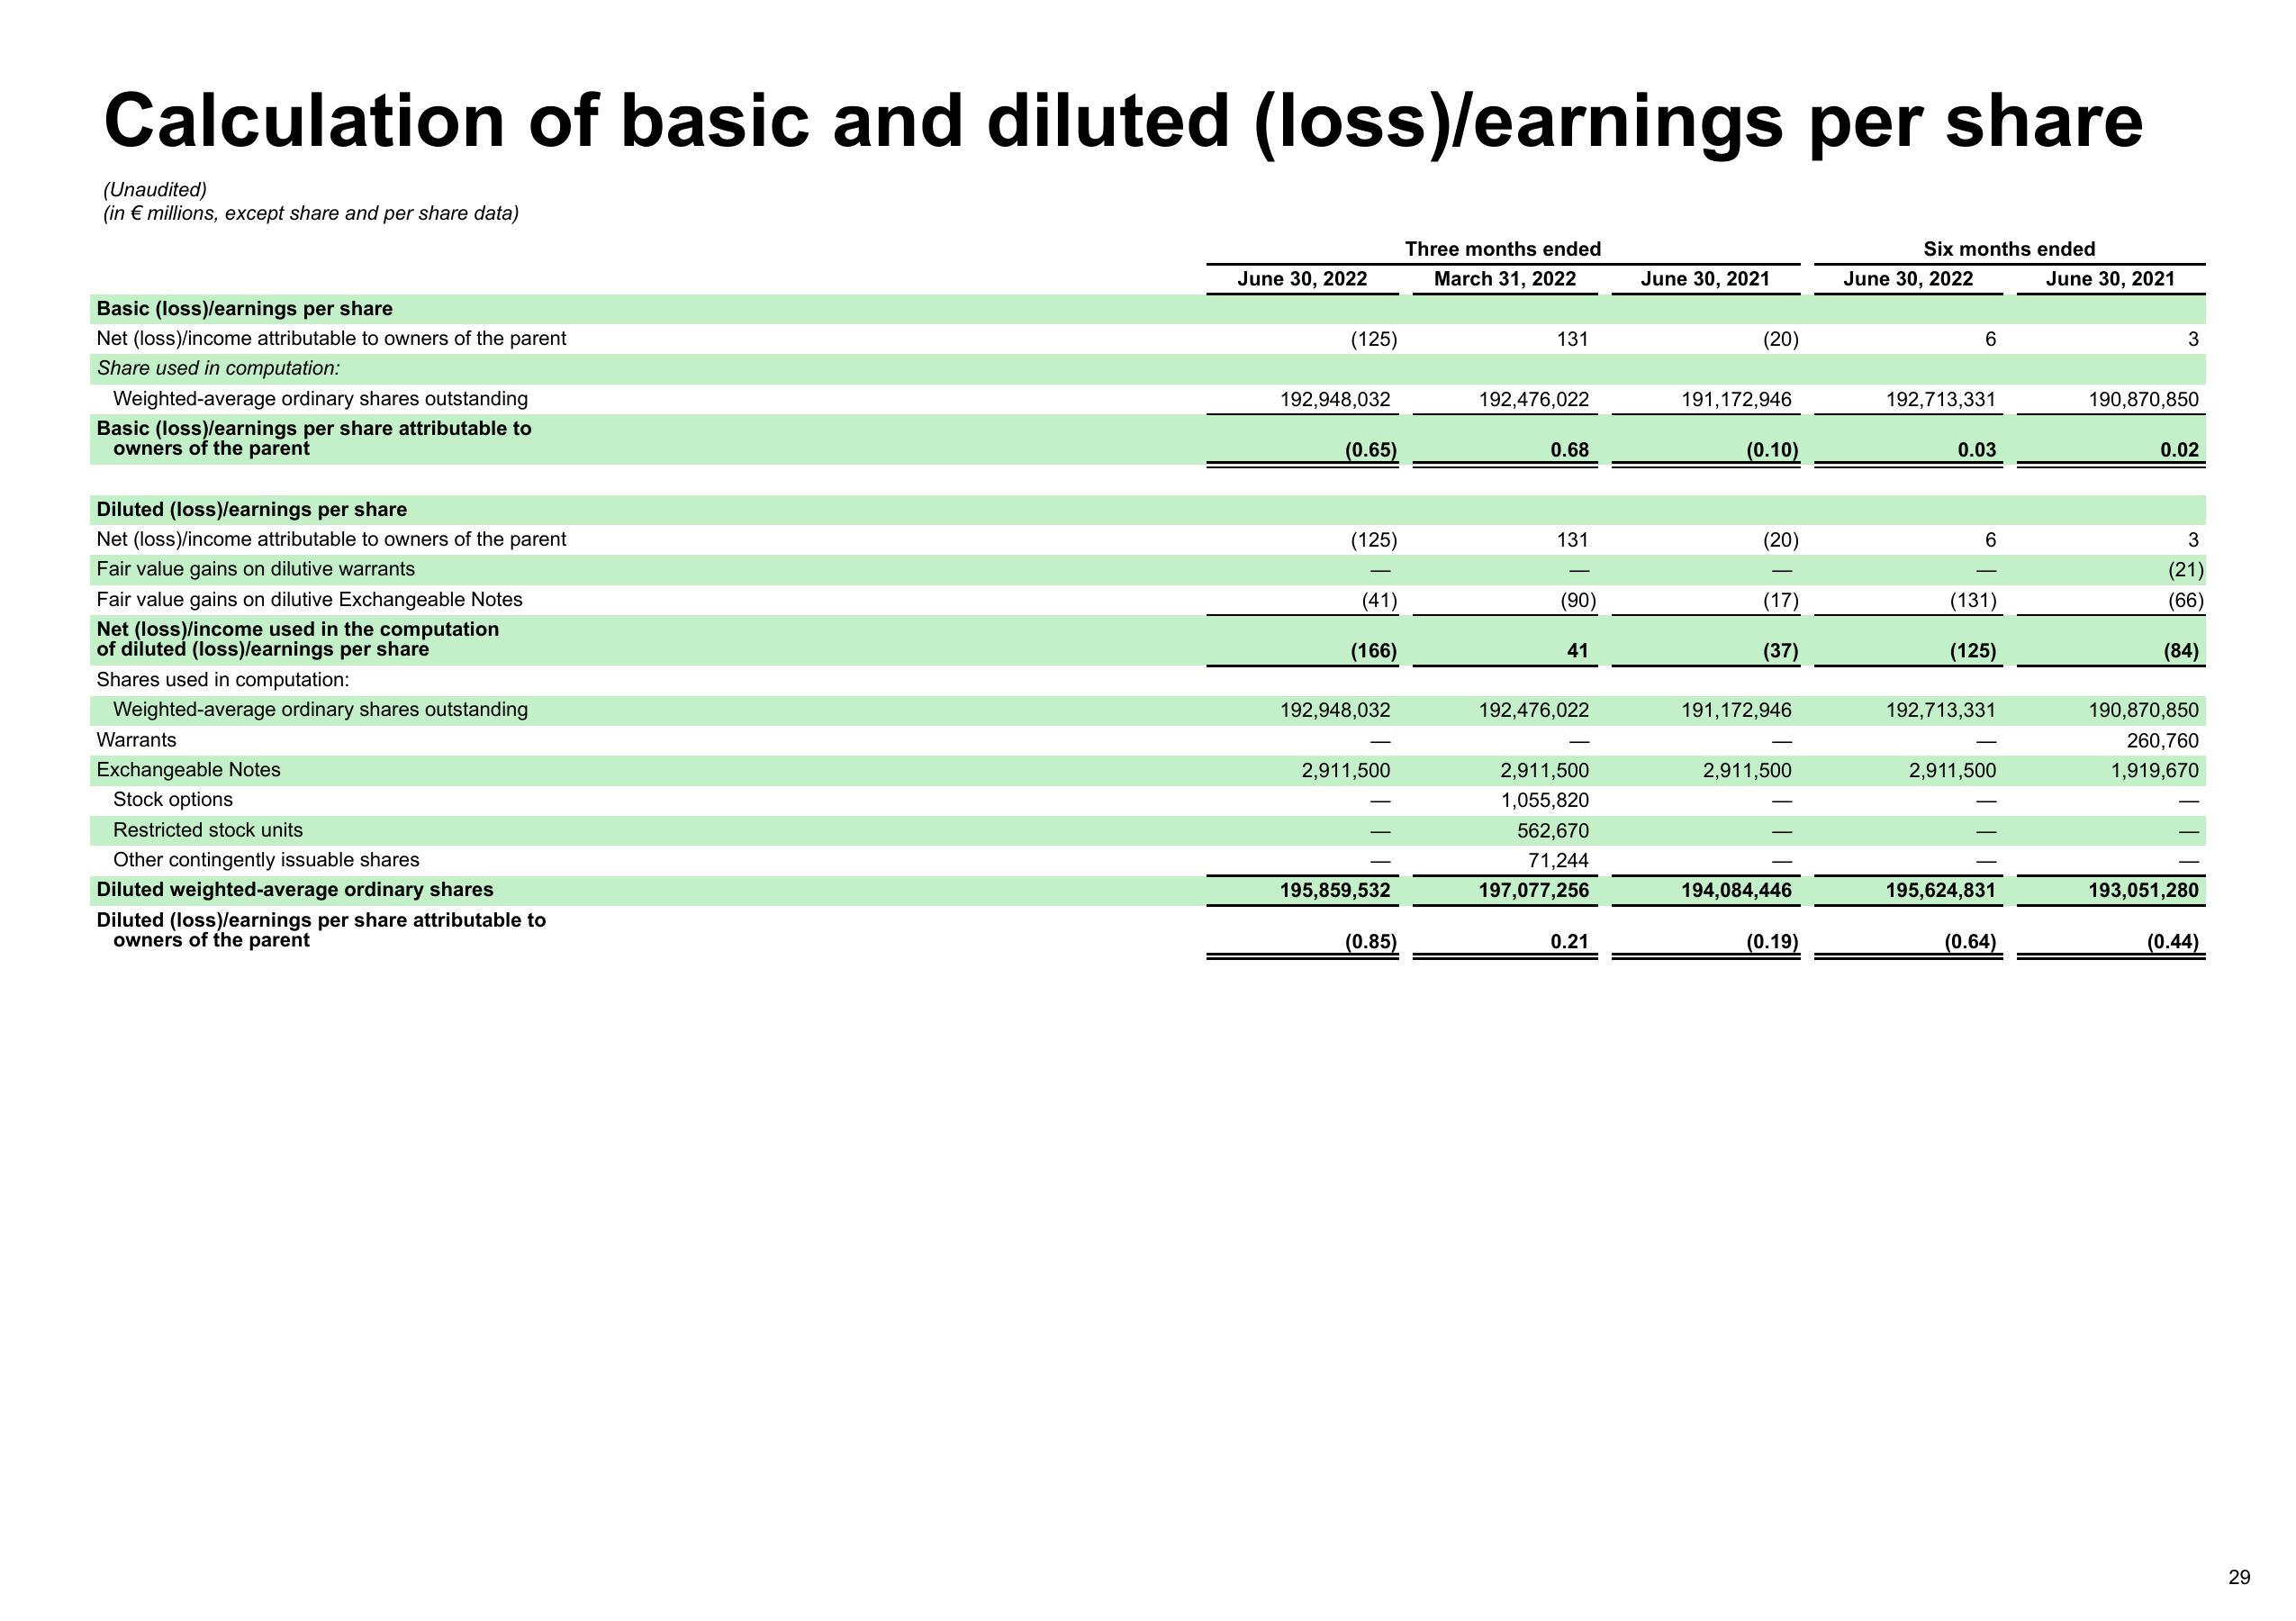
Calculation of basic and diluted (loss)/earnings per share
(Unaudited)
(in € millions, except share and per share data)
Basic (loss)/earnings per share
Net (loss)/income attributable to owners of the parent
Share used in computation:
Weighted-average ordinary shares outstanding
Basic (loss)/earnings per share attributable to
owners of the parent
Diluted (loss)/earnings per share
Net (loss)/income attributable to owners of the parent
Fair value gains on dilutive warrants
Fair value gains on dilutive Exchangeable Notes
Net (loss)/income used in the computation
of diluted (loss)/earnings per share
Shares used in computation:
Weighted-average ordinary shares outstanding
Warrants
Exchangeable Notes
Stock options
Restricted stock units
Other contingently issuable shares
Diluted weighted-average ordinary shares
Diluted (loss)/earnings per share attributable to
owners of the parent
June 30, 2022
(125)
192,948,032
(0.65)
(125)
(41)
(166)
192,948,032
2,911,500
195,859,532
(0.85)
Three months ended
March 31, 2022
131
192,476,022
0.68
131
(90)
41
192,476,022
2,911,500
1,055,820
562,670
71,244
197,077,256
0.21
June 30, 2021
(20)
191,172,946
(0.10)
(20)
(17)
(37)
191,172,946
2,911,500
194,084,446
(0.19)
Six months ended
June 30, 2022
6
192,713,331
0.03
6
(131)
(125)
192,713,331
2,911,500
195,624,831
(0.64)
June 30, 2021
3
190,870,850
0.02
3
(21)
(66)
(84)
190,870,850
260,760
1,919,670
193,051,280
(0.44)
29View entire presentation