Granite Ridge Investor Presentation Deck
Overview
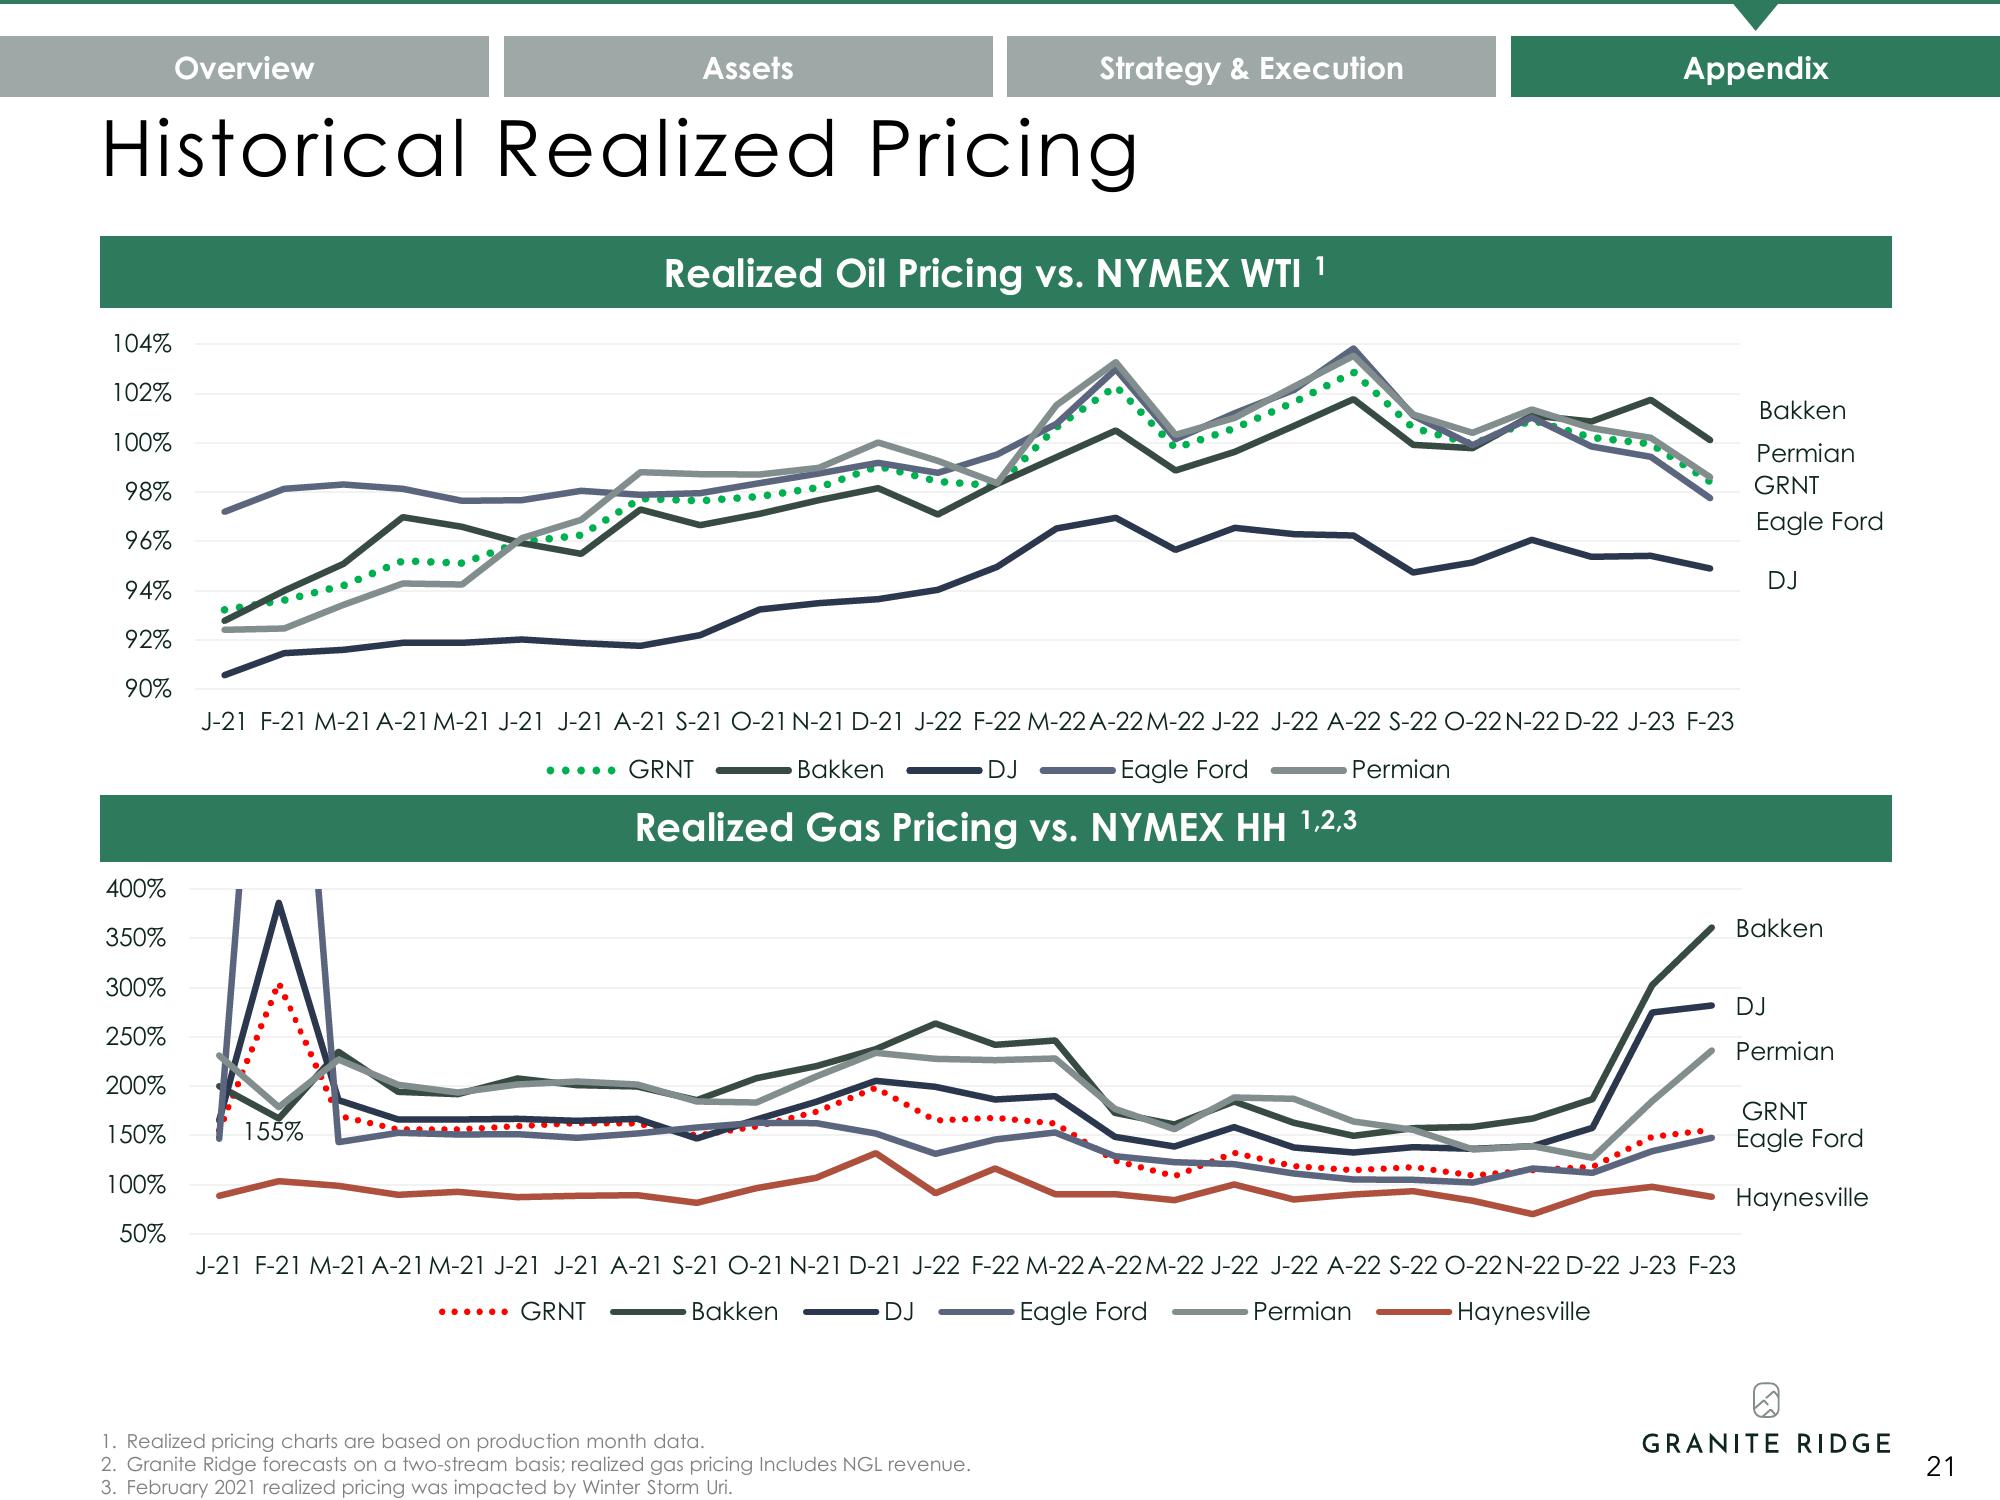
Historical Realized Pricing
104%
102%
100%
98%
96%
94%
92%
90%
400%
350%
300%
250%
200%
150%
100%
50%
155%
Assets
......
Strategy & Execution
Realized Oil Pricing vs. NYMEX WTI ¹
J-21 F-21 M-21 A-21 M-21 J-21 J-21 A-21 S-21 O-21 N-21 D-21 J-22 F-22 M-22 A-22 M-22 J-22 J-22 A-22 S-22 O-22 N-22 D-22 J-23 F-23
..... GRNT
Bakken
DJ
Eagle Ford
Permian
Realized Gas Pricing vs. NYMEX HH 1,2,3
Appendix
1. Realized pricing charts are based on production month data.
2. Granite Ridge forecasts on a two-stream basis; realized gas pricing Includes NGL revenue.
3. February 2021 realized pricing was impacted by Winter Storm Uri.
Bakken
Permian
GRNT
Eagle Ford
Bakken
DJ
J-21 F-21 M-21 A-21 M-21 J-21 J-21 A-21 S-21 O-21 N-21 D-21 J-22 F-22 M-22 A-22 M-22 J-22 J-22 A-22 S-22 O-22 N-22 D-22 J-23 F-23
GRNT
Bakken
DJ
Eagle Ford
Permian
Haynesville
DJ
Permian
GRNT
Eagle Ford
Haynesville
GRANITE RIDGE
21View entire presentation