Tradeweb Results Presentation Deck
1Q22 Financial Performance ¹
($ in thousands, except
share and per share
amounts)
Trading Revenues
Fixed 3
Variable
10
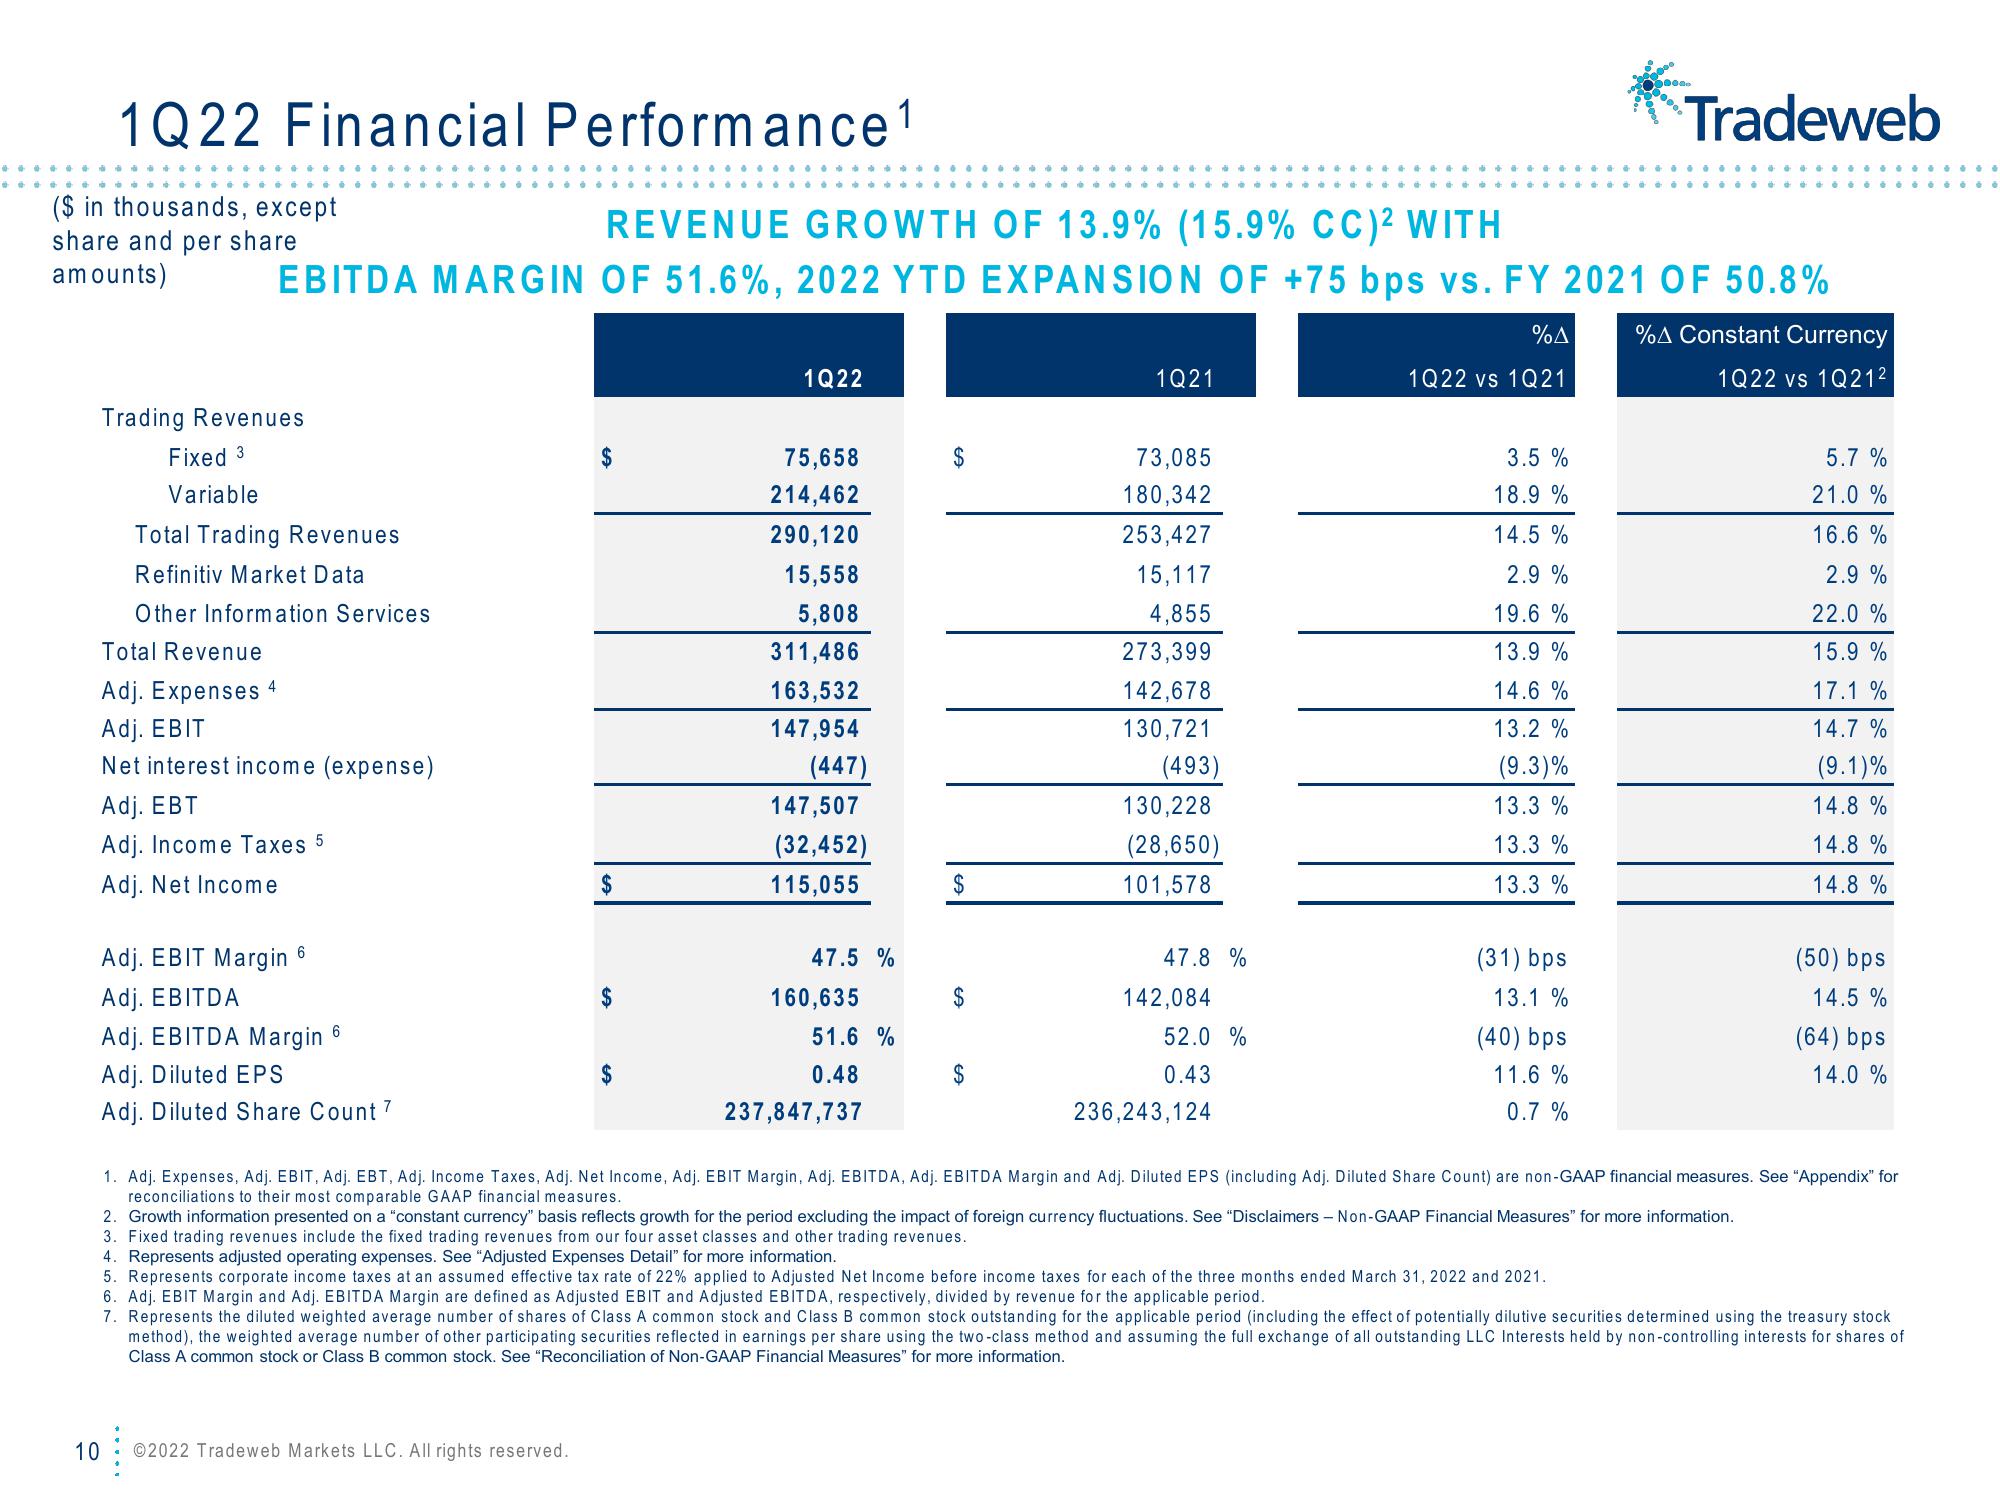
REVENUE GROWTH OF 13.9% (15.9% CC) ² WITH
EBITDA MARGIN OF 51.6%, 2022 YTD EXPANSION OF +75 bps vs. FY 2021 OF 50.8%
Total Trading Revenues
Refinitiv Market Data
Other Information Services
Total Revenue
Adj. Expenses 4
Adj. EBIT
Net interest income (expense)
Adj. EBT
Adj. Income Taxes 5
Adj. Net Income
Adj. EBIT Margin 6
Adj. EBITDA
Adj. EBITDA Margin 6
Adj. Diluted EPS
Adj. Diluted Share Count 7
$
$
$
$
©2022 Tradeweb Markets LLC. All rights reserved.
1Q22
75,658
214,462
290,120
15,558
5,808
311,486
163,532
147,954
(447)
147,507
(32,452)
115,055
47.5 %
160,635
51.6 %
0.48
237,847,737
$
$
$
1Q21
73,085
180,342
253,427
15,117
4,855
273,399
142,678
130,721
(493)
130,228
(28,650)
101,578
47.8%
142,084
52.0 %
0.43
236,243,124
1Q22 vs 1Q21
%A %A Constant Currency
1Q22 vs 1Q21²
3.5 %
18.9%
14.5%
2.9%
19.6 %
13.9%
14.6%
13.2 %
(9.3)%
13.3%
13.3 %
13.3%
(31) bps
13.1 %
0000
(40) bps
11.6 %
0.7%
Tradeweb
4. Represents adjusted operating expenses. See "Adjusted Expenses Detail" for more information.
5. Represents corporate income taxes at an assumed effective tax rate of 22% applied to Adjusted Net Income before income taxes for each of the three months ended March 31, 2022 and 2021.
2. Growth information presented on a "constant currency" basis reflects growth for the period excluding the impact of foreign currency fluctuations. See "Disclaimers - Non-GAAP Financial Measures" for more information.
3. Fixed trading revenues include the fixed trading revenues from our four asset classes and other trading revenues.
5.7 %
21.0%
16.6%
2.9 %
22.0%
15.9 %
17.1 %
14.7%
(9.1)%
14.8 %
14.8 %
14.8 %
1. Adj. Expenses, Adj. EBIT, Adj. EBT, Adj. Income Taxes, Adj. Net Income, Adj. EBIT Margin, Adj. EBITDA, Adj. EBITDA Margin and Adj. Diluted EPS (including Adj. Diluted Share Count) are non-GAAP financial measures. See "Appendix" for
reconciliations to their most comparable GAAP financial measures.
(50) bps
14.5%
(64) bps
14.0 %
6. Adj. EBIT Margin and Adj. EBITDA Margin are defined as Adjusted EBIT and Adjusted EBITDA, respectively, divided by revenue for the applicable period.
7. Represents the diluted weighted average number of shares of Class A common stock and Class B common stock outstanding for the applicable period (including the effect of potentially dilutive securities determined using the treasury stock
method), the weighted average number of other participating securities reflected in earnings per share using the two-class method and assuming the full exchange of all outstanding LLC Interests held by non-controlling interests for shares of
Class A common stock or Class B common stock. See "Reconciliation of Non-GAAP Financial Measures" for more information.View entire presentation