Docebo Investor Presentation Deck
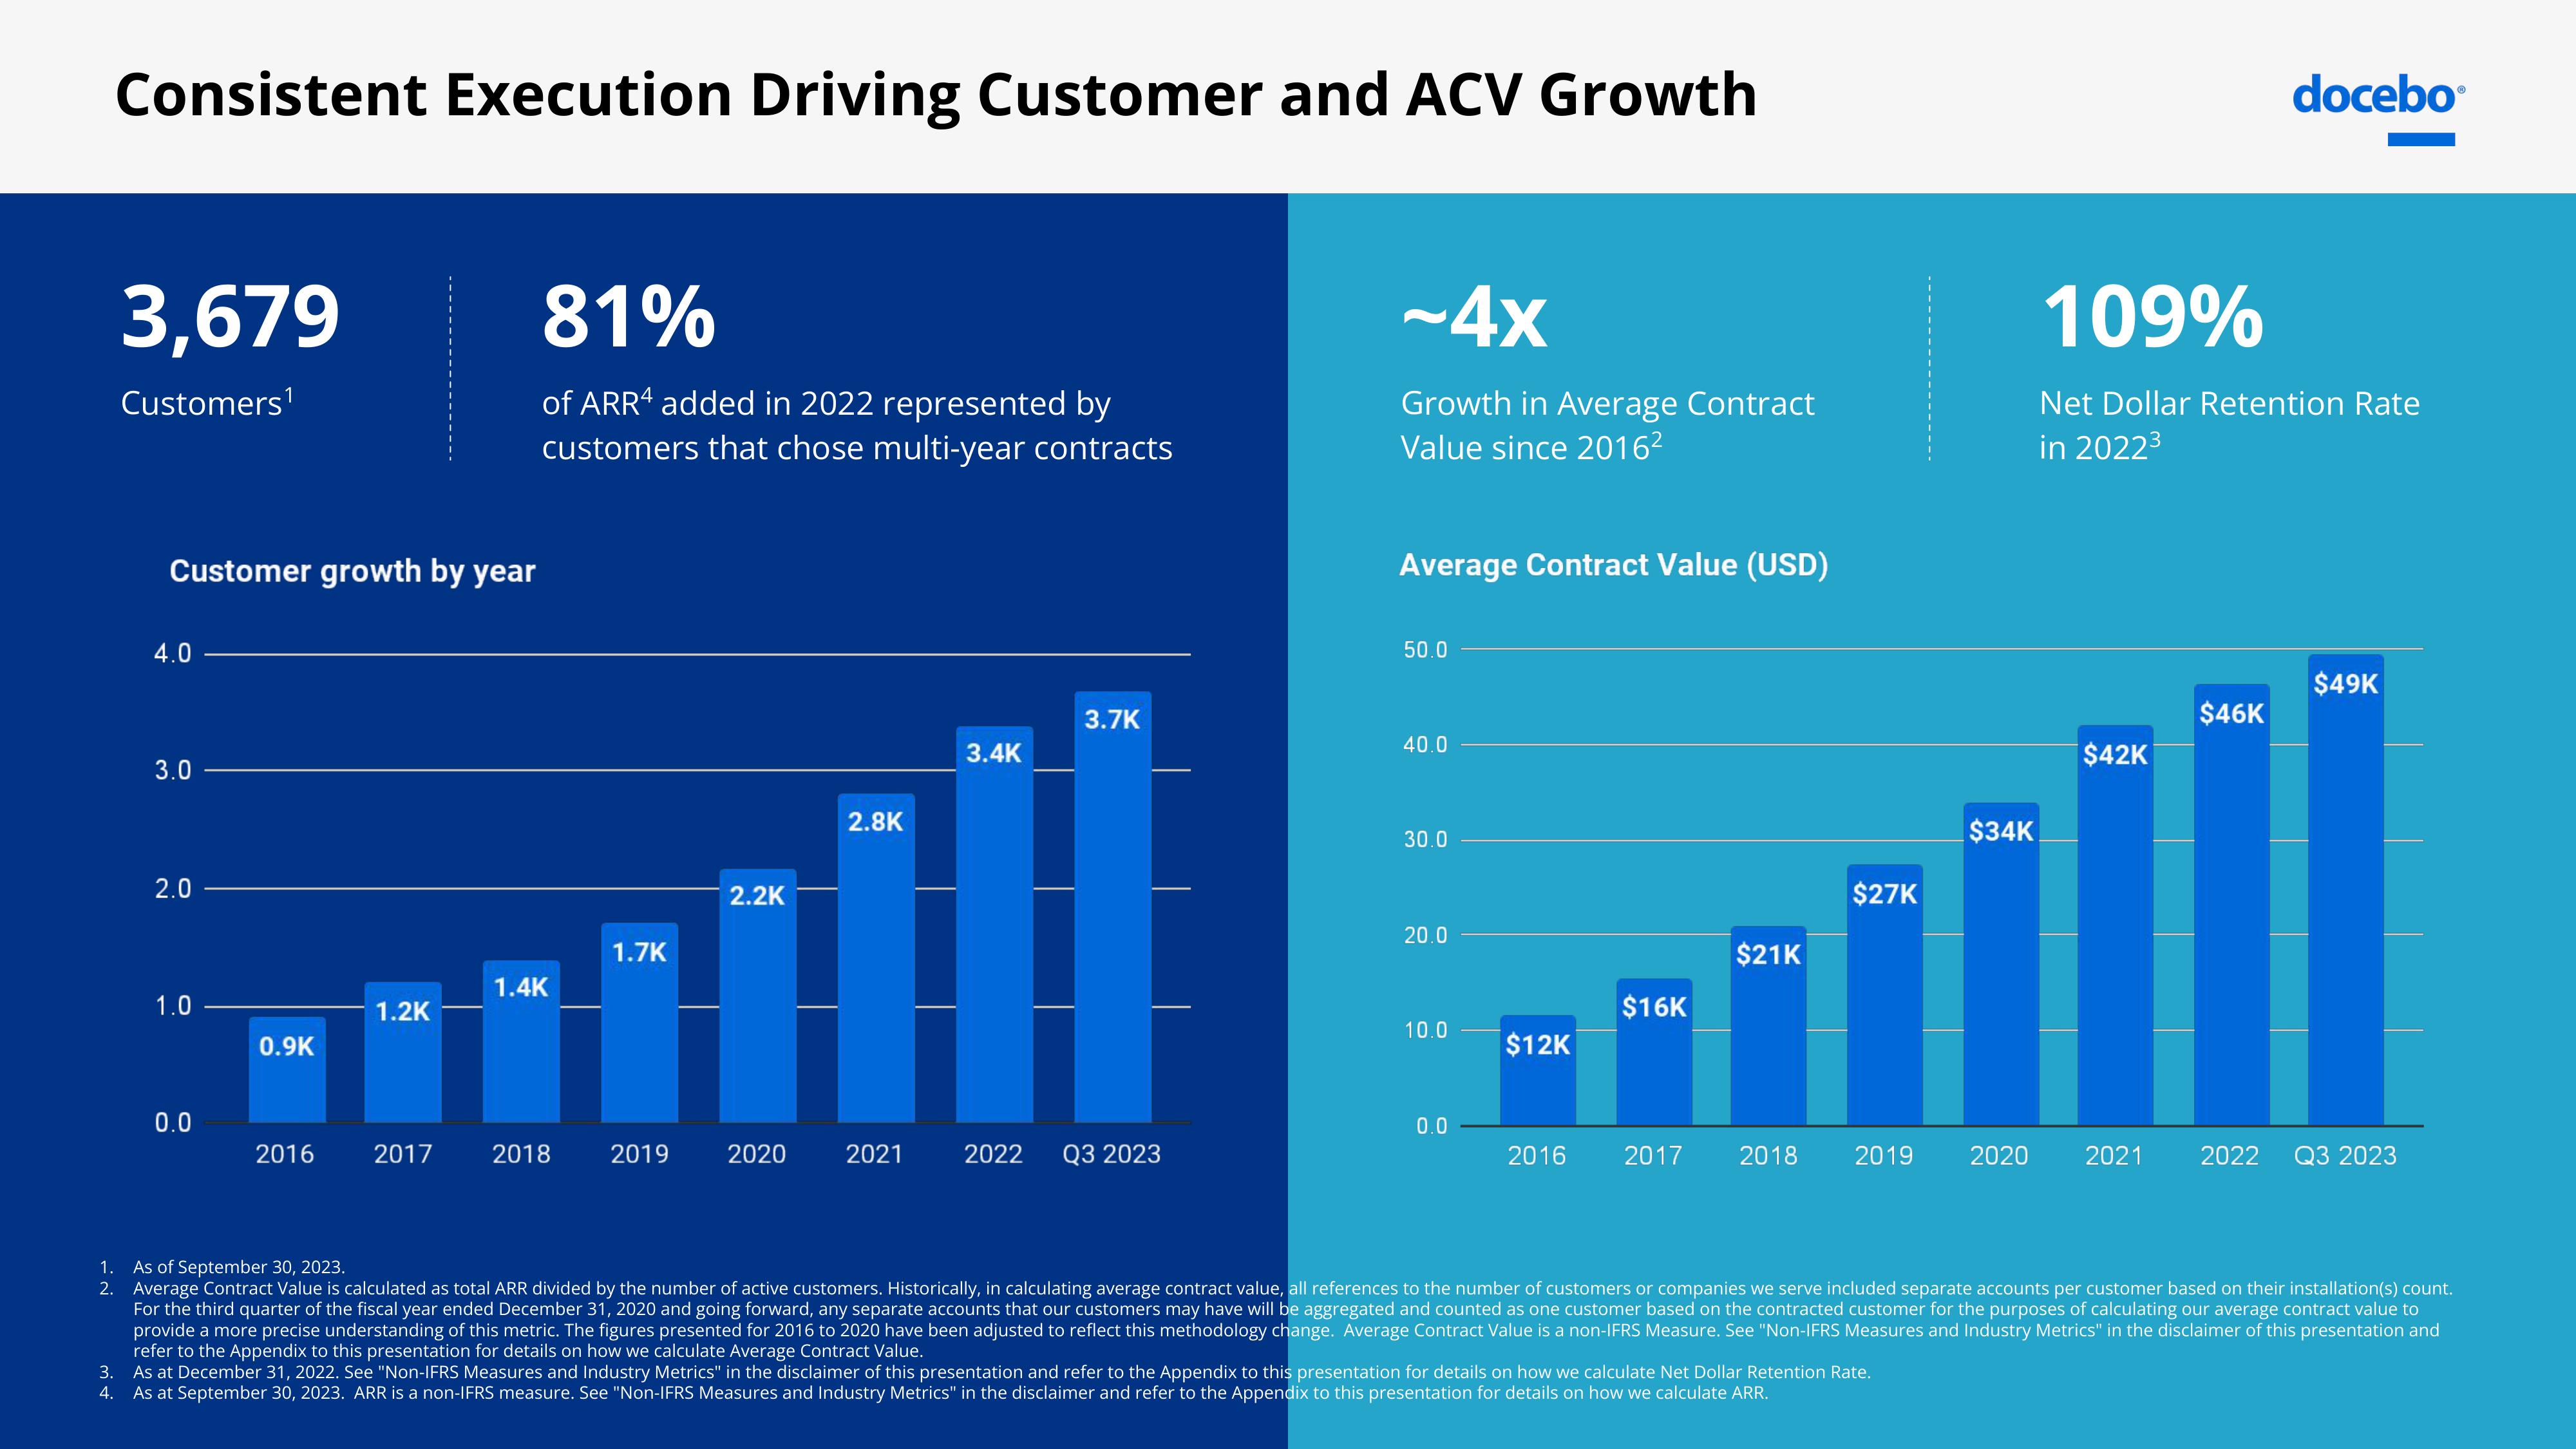
Consistent Execution Driving Customer and ACV Growth
3,679
Customers¹
Customer growth by year
4.0
3.0
2.0
1.0
0.0
0.9K
2016
1.2K
81%
of ARR4 added in 2022 represented by
customers that chose multi-year contracts
1.4K
1.7K
2.2K
2017 2018 2019 2020
2.8K
2021
3.4K
2022
3.7K
Q3 2023
~4x
Growth in Average Contract
Value since 2016²
Average Contract Value (USD)
50.0
40.0
30.0
20.0
10.0
0.0
$12K
$16K
$21K
$27K
$34K
2016 2017 2018 2019 2020
109%
Net Dollar Retention Rate
in 2022³
$42K
2021
$46K
docebo
2022
$49K
Q3 2023
1. As of September 30, 2023.
2. Average Contract Value is calculated as total ARR divided by the number of active customers. Historically, in calculating average contract value, all references to the number of customers or companies we serve included separate accounts per customer based on their installation(s) count.
For the third quarter of the fiscal year ended December 31, 2020 and going forward, any separate accounts that our customers may have will be aggregated and counted as one customer based on the contracted customer for the purposes of calculating our average contract value to
provide a more precise understanding of this metric. The figures presented for 2016 to 2020 have been adjusted to reflect this methodology change. Average Contract Value is a non-IFRS Measure. See "Non-IFRS Measures and Industry Metrics" in the disclaimer of this presentation and
refer to the Appendix to this presentation for details on how we calculate Average Contract Value.
3.
As at December 31, 2022. See "Non-IFRS Measures and Industry Metrics" in the disclaimer of this presentation and refer to the Appendix to this presentation for details on how we calculate Net Dollar Retention Rate.
4. As at September 30, 2023. ARR is a non-IFRS measure. See "Non-IFRS Measures and Industry Metrics" in the disclaimer and refer to the Appendix to this presentation for details on how we calculate ARR.View entire presentation