CAVA Results Presentation Deck
BUSINESS HIGHLIGHTS
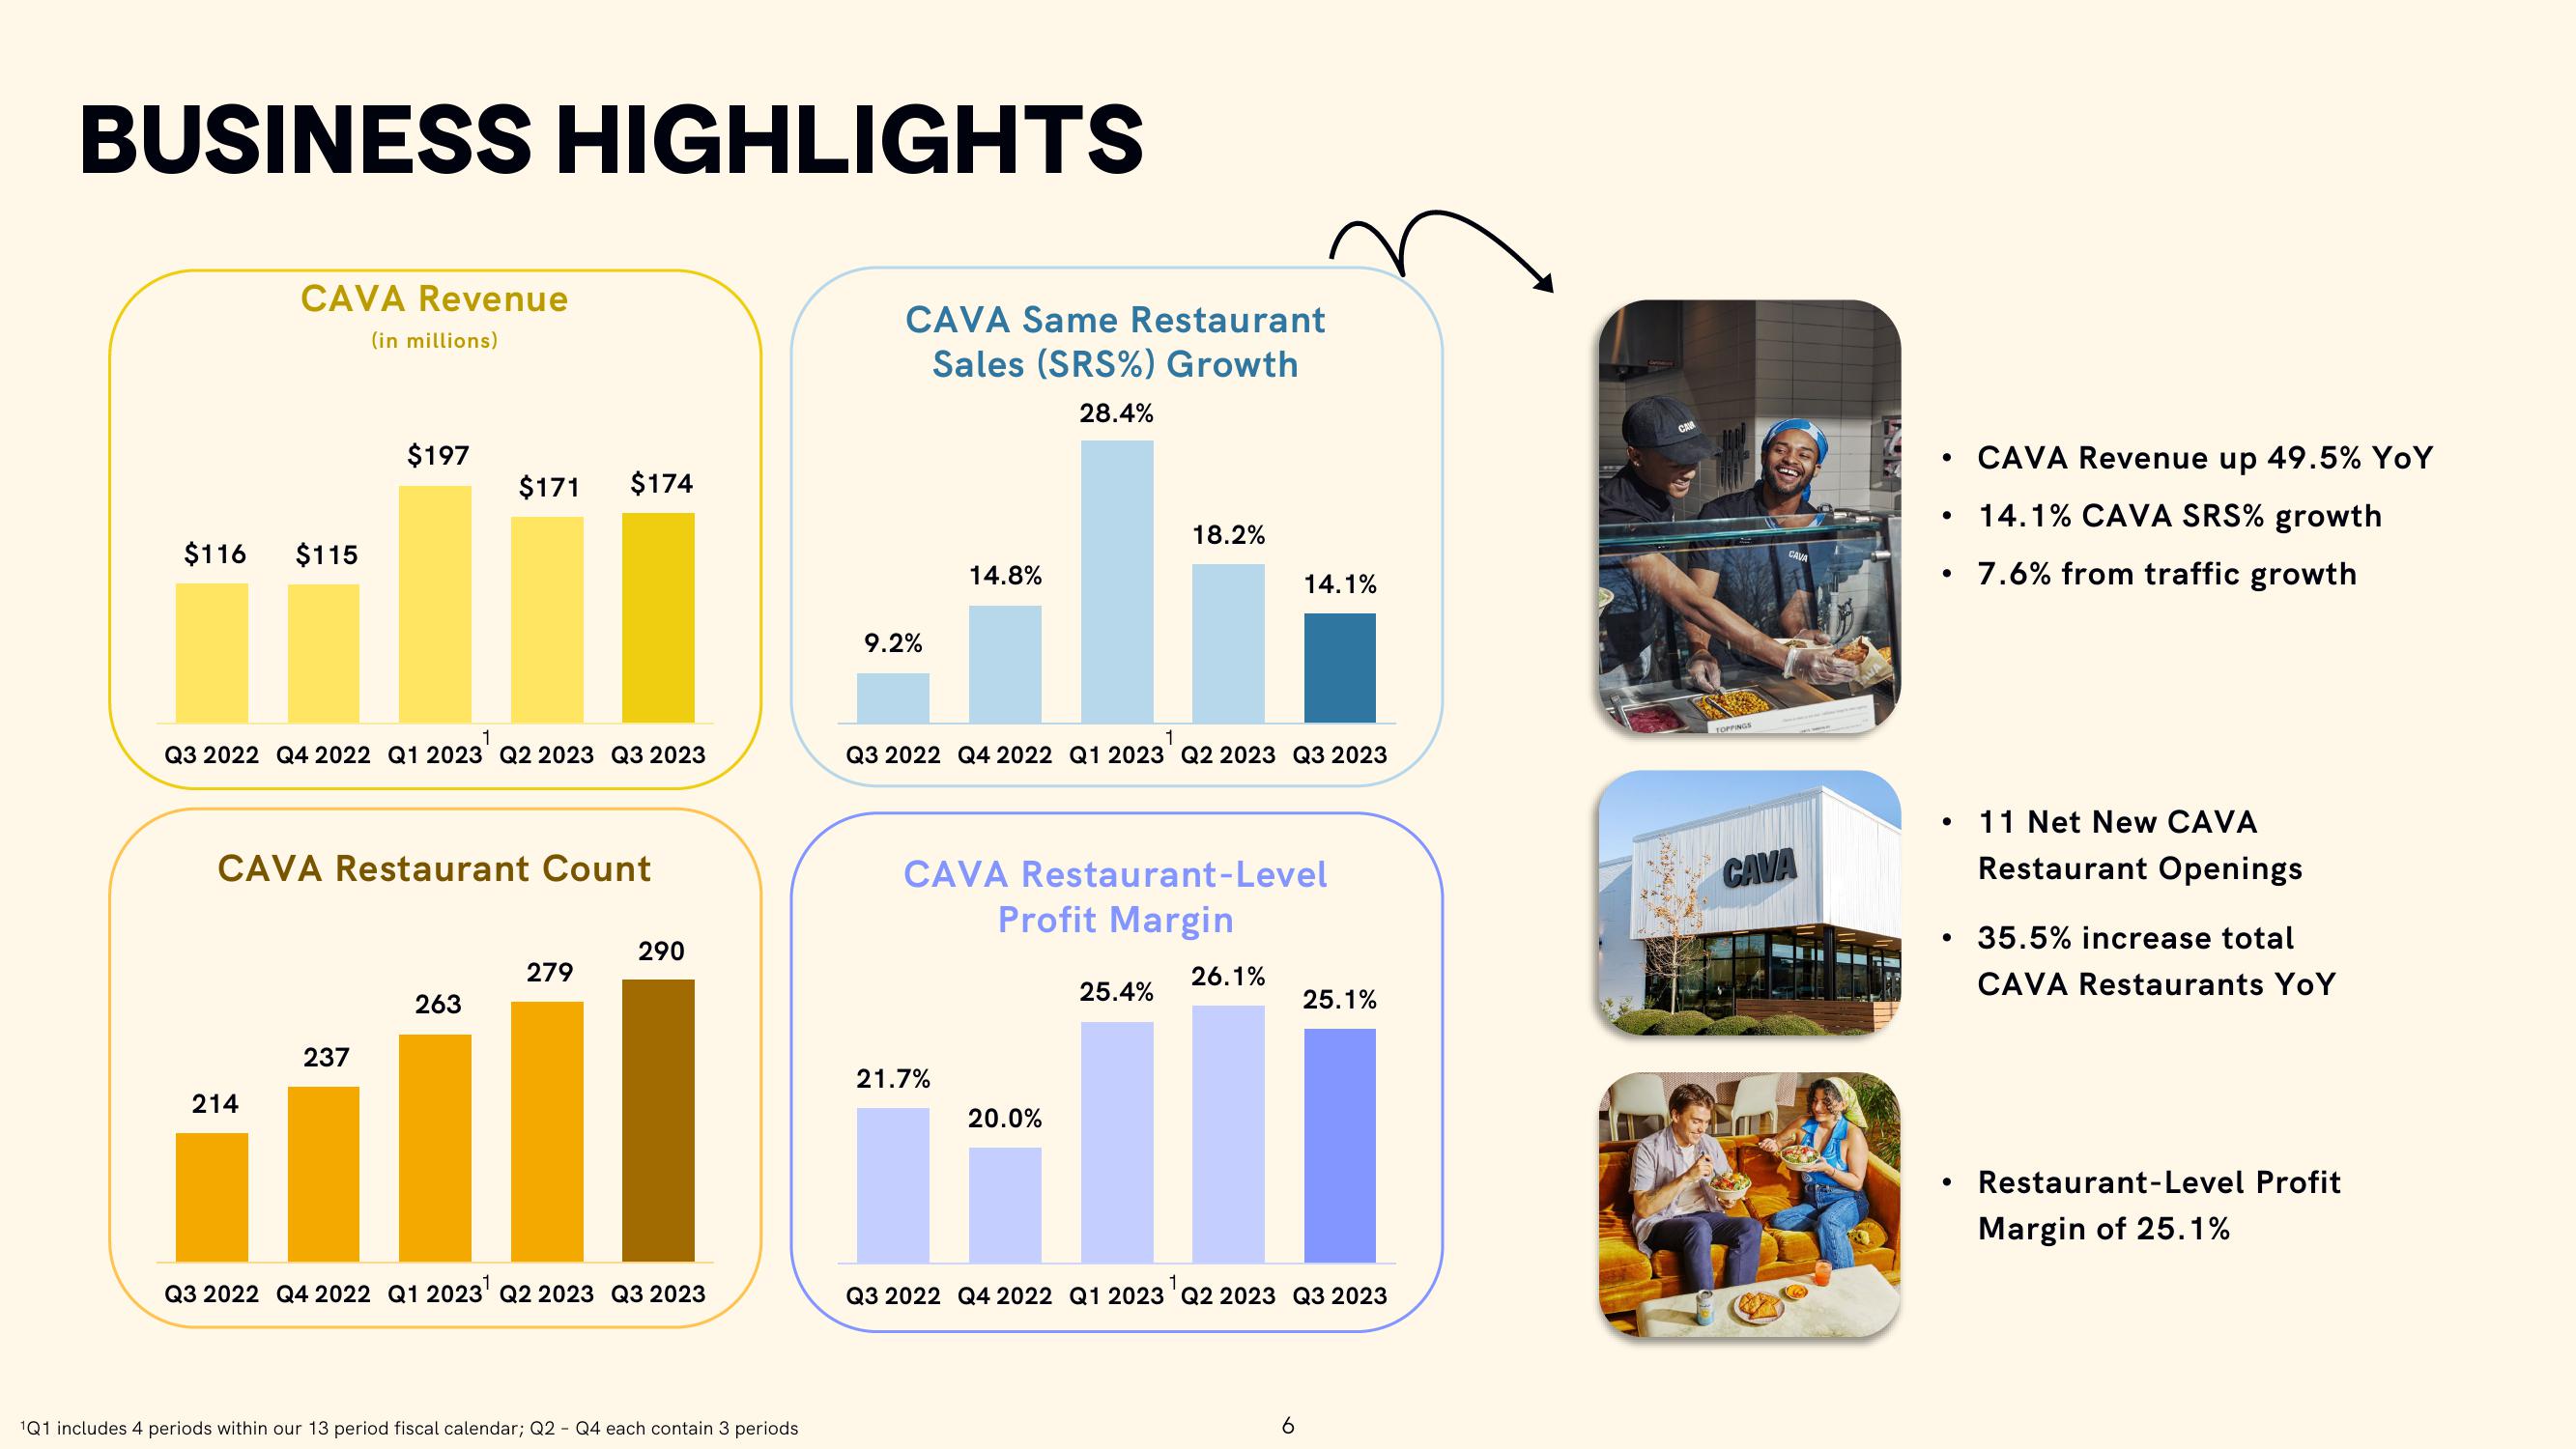
CAVA Revenue
(in millions)
$116 $115
214
$197
Q3 2022 Q4 2022 Q1 2023¹ Q2 2023 Q3 2023
CAVA Restaurant Count
237
$171 $174
263
279
290
Q3 2022 Q4 2022 Q1 2023¹ Q2 2023 Q3 2023
1Q1 includes 4 periods within our 13 period fiscal calendar; Q2 Q4 each contain 3 periods
CAVA Same Restaurant
Sales (SRS%) Growth
28.4%
9.2%
14.8%
21.7%
18.2%
1
Q3 2022 Q4 2022 Q1 2023 Q2 2023 Q3 2023
CAVA Restaurant-Level
Profit Margin
20.0%
26.1%
25.4%
ill
14.1%
6
25.1%
1
Q3 2022 Q4 2022 Q1 2023 Q2 2023 Q3 2023
TOPPINGS
CAVA
CAVA
●
●
●
●
●
●
CAVA Revenue up 49.5% YoY
14.1% CAVA SRS% growth
7.6% from traffic growth
11 Net New CAVA
Restaurant Openings
35.5% increase total
CAVA Restaurants YoY
Restaurant-Level Profit
Margin of 25.1%View entire presentation