Vivid Seats Results Presentation Deck
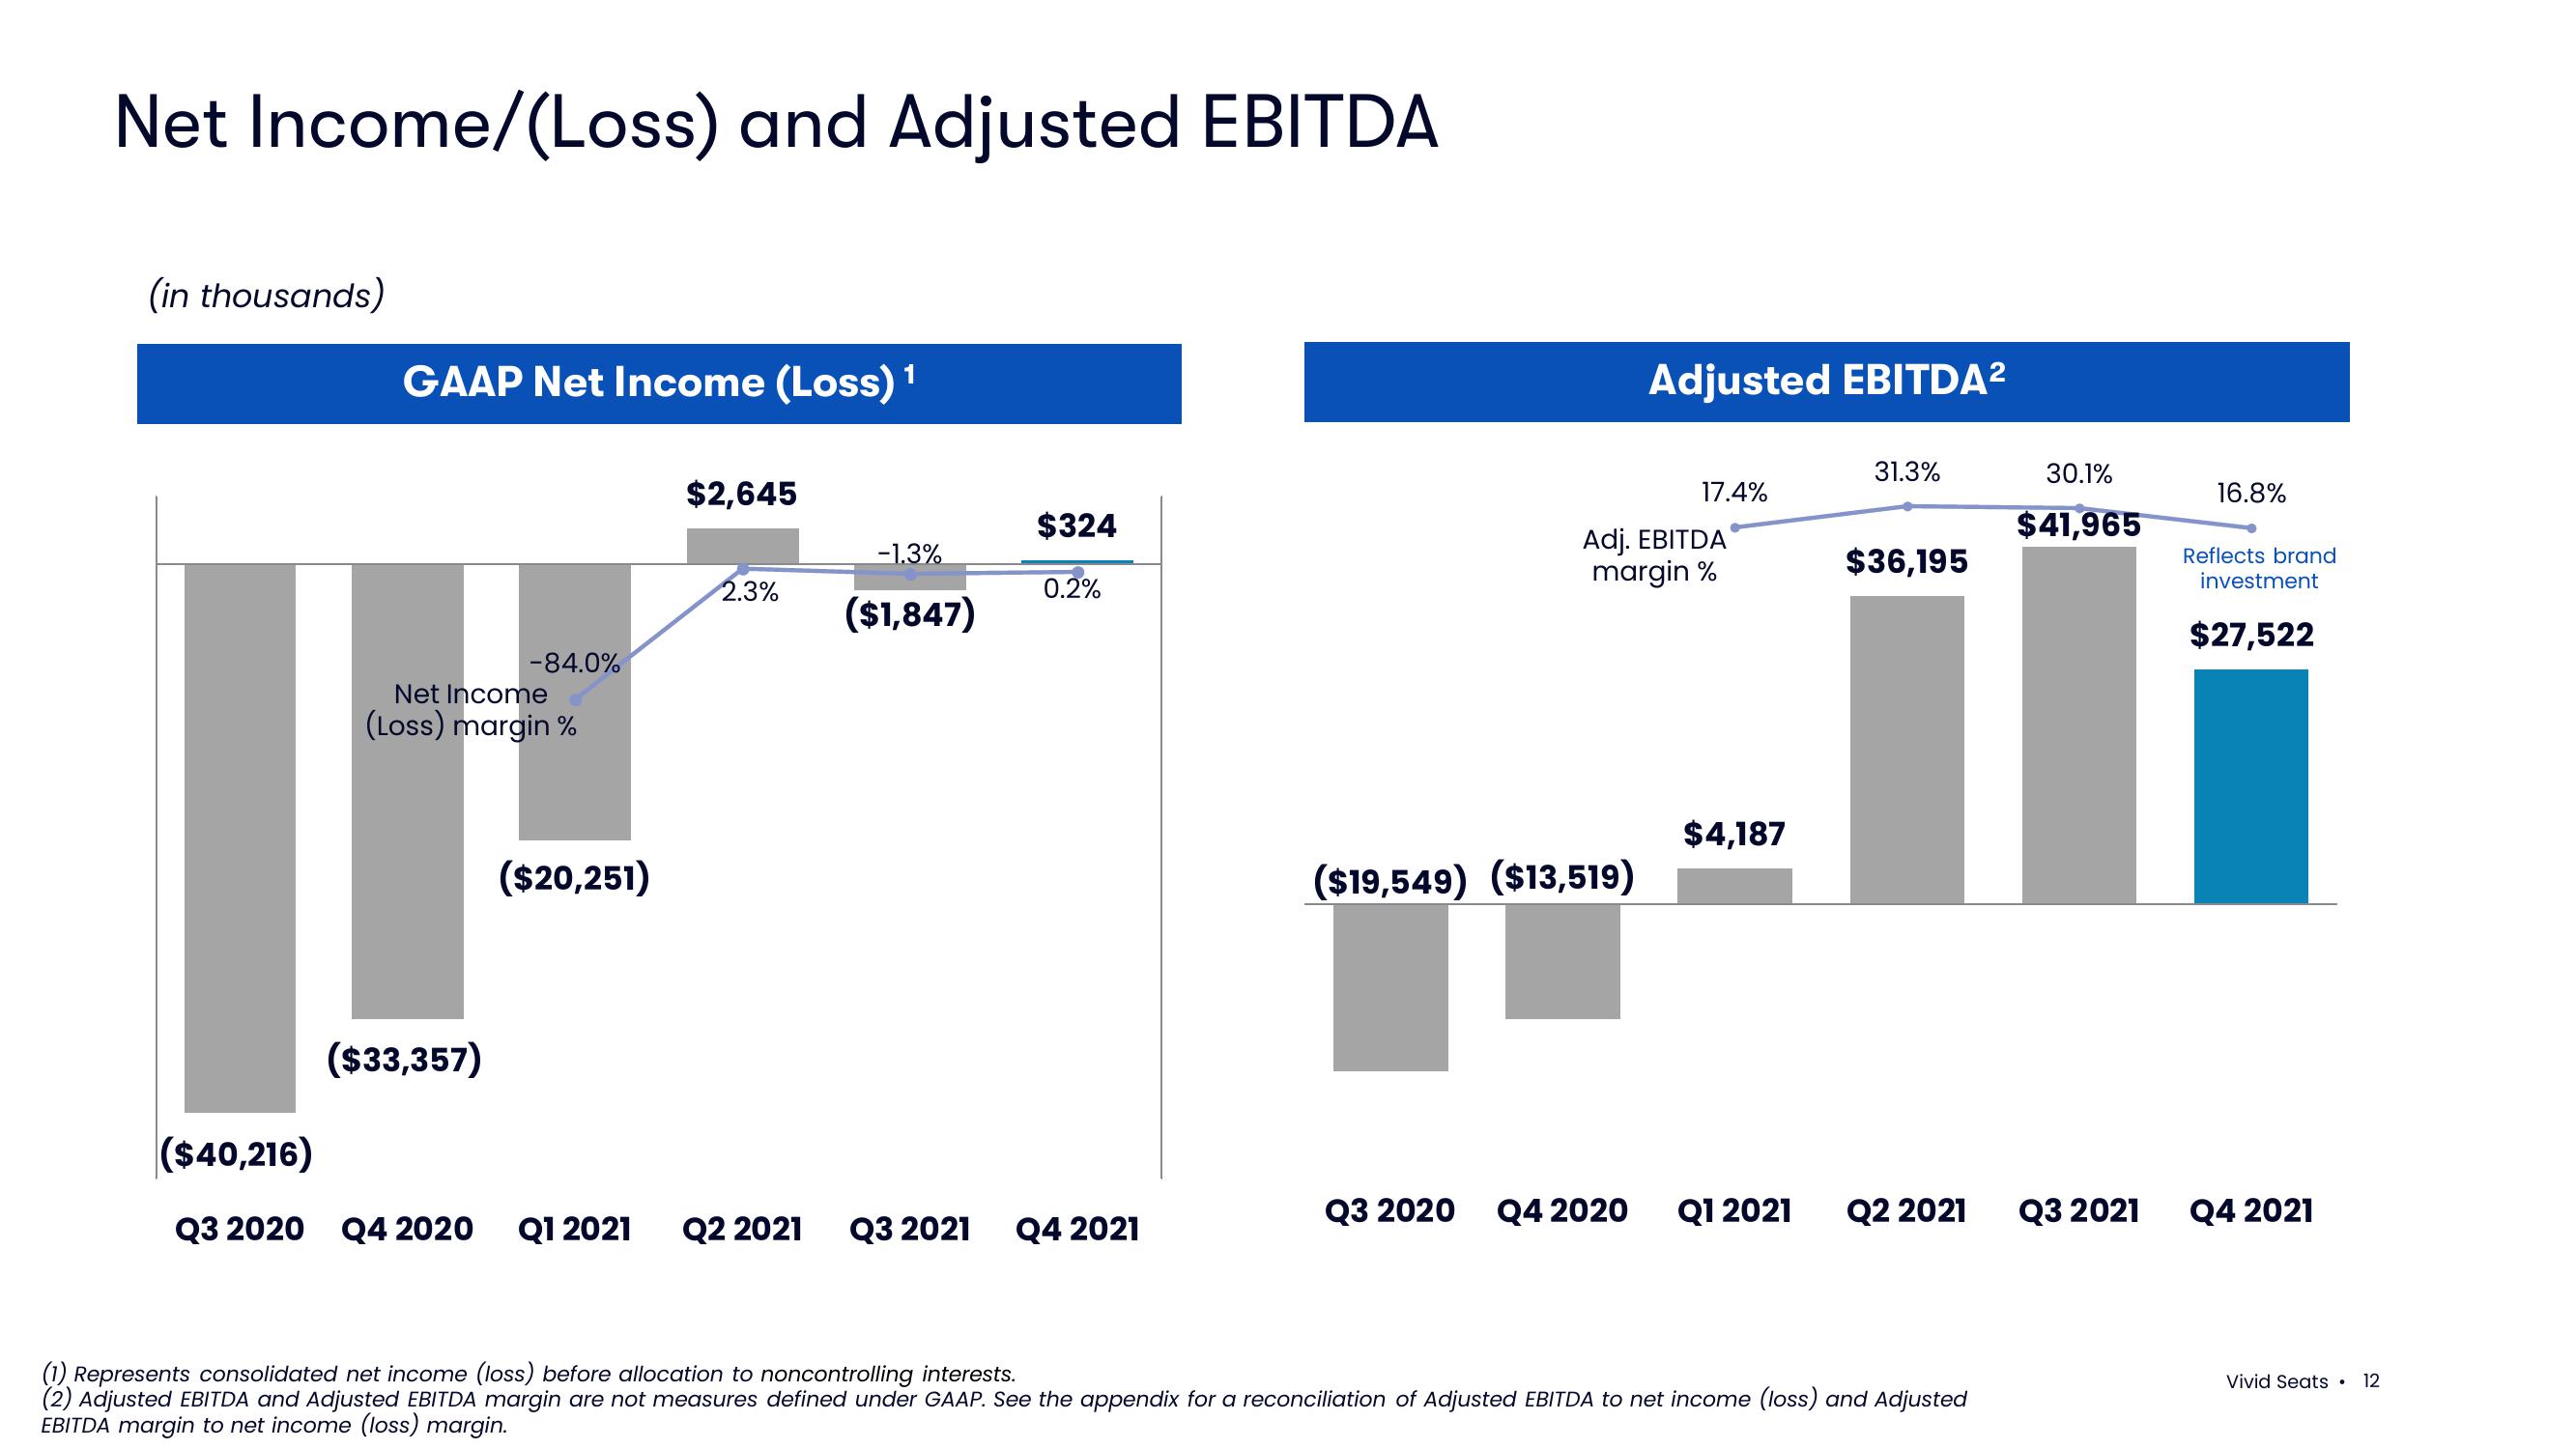
Net Income/(Loss) and Adjusted EBITDA
(in thousands)
GAAP Net Income (Loss) ¹
1
-84.0%
Net Income
(Loss) margin%
($33,357)
($20,251)
$2,645
2.3%
-1.3%
($1,847)
$324
0.2%
($40,216)
Q3 2020 Q4 2020 Q1 2021 Q2 2021 Q3 2021 Q4 2021
($19,549) ($13,519)
Adjusted EBITDA²
Adj. EBITDA
margin %
Q3 2020 Q4 2020
17.4%
$4,187
Q1 2021
31.3%
$36,195
1
Q2 2021
30.1%
$41,965
(1) Represents consolidated net income (loss) before allocation to noncontrolling interests.
(2) Adjusted EBITDA and Adjusted EBITDA margin are not measures defined under GAAP. See the appendix for a reconciliation of Adjusted EBITDA to net income (loss) and Adjusted
EBITDA margin to net income (loss) margin.
Q3 2021
16.8%
Reflects brand
investment
$27,522
Q4 2021
Vivid Seats . 12View entire presentation