WeWork SPAC Presentation Deck
2021: Repositioned and on the path to recovery
Recent cost optimization efforts have set the Company up for profitable growth in 2021 and beyond
Total Workstations
(in thousands)
1.
2.
Ending Physical Occupancy(¹):
72%
855
46%
1,030
70%
954
2019A
2020A
2021E
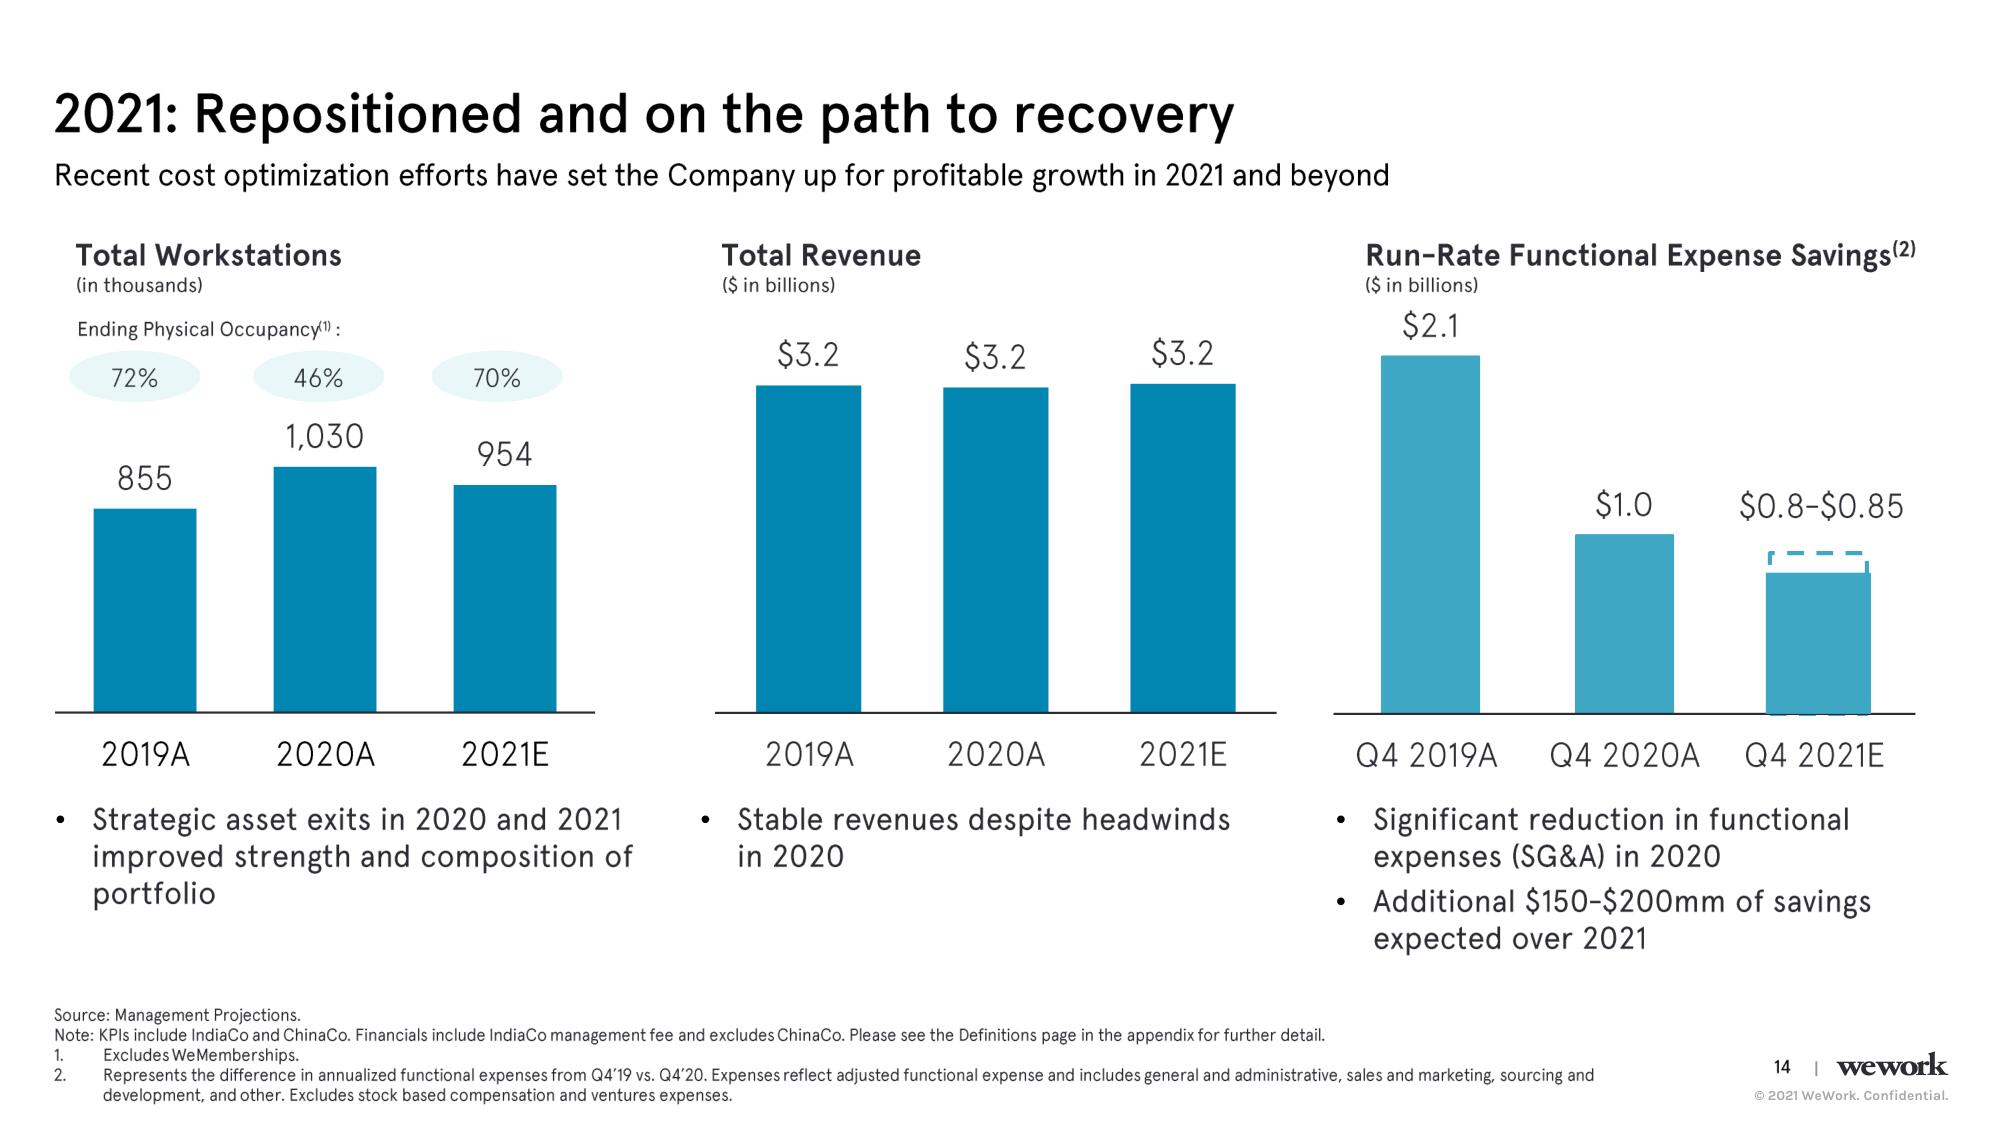
Strategic asset exits in 2020 and 2021
improved strength and composition of
portfolio
●
Total Revenue
($ in billions)
$3.2
$3.2
$3.2
2019A
2020A
2021E
Stable revenues despite headwinds
in 2020
●
Run-Rate Functional Expense Savings (2)
($ in billions)
$2.1
$1.0
Source: Management Projections.
Note: KPIs include IndiaCo and ChinaCo. Financials include IndiaCo management fee and excludes ChinaCo. Please see the Definitions page in the appendix for further detail.
Excludes We Memberships.
Represents the difference in annualized functional expenses from Q4'19 vs. Q4'20. Expenses reflect adjusted functional expense and includes general and administrative, sales and marketing, sourcing and
development, and other. Excludes stock based compensation and ventures expenses.
$0.8-$0.85
Q4 2019A
Q4 2020A Q4 2021E
Significant reduction in functional
expenses (SG&A) in 2020
Additional $150-$200mm of savings
expected over 2021
14 | wework
Ⓒ2021 WeWork. Confidential.View entire presentation