AMD Results Presentation Deck slide image

AMD Results Presentation Deck

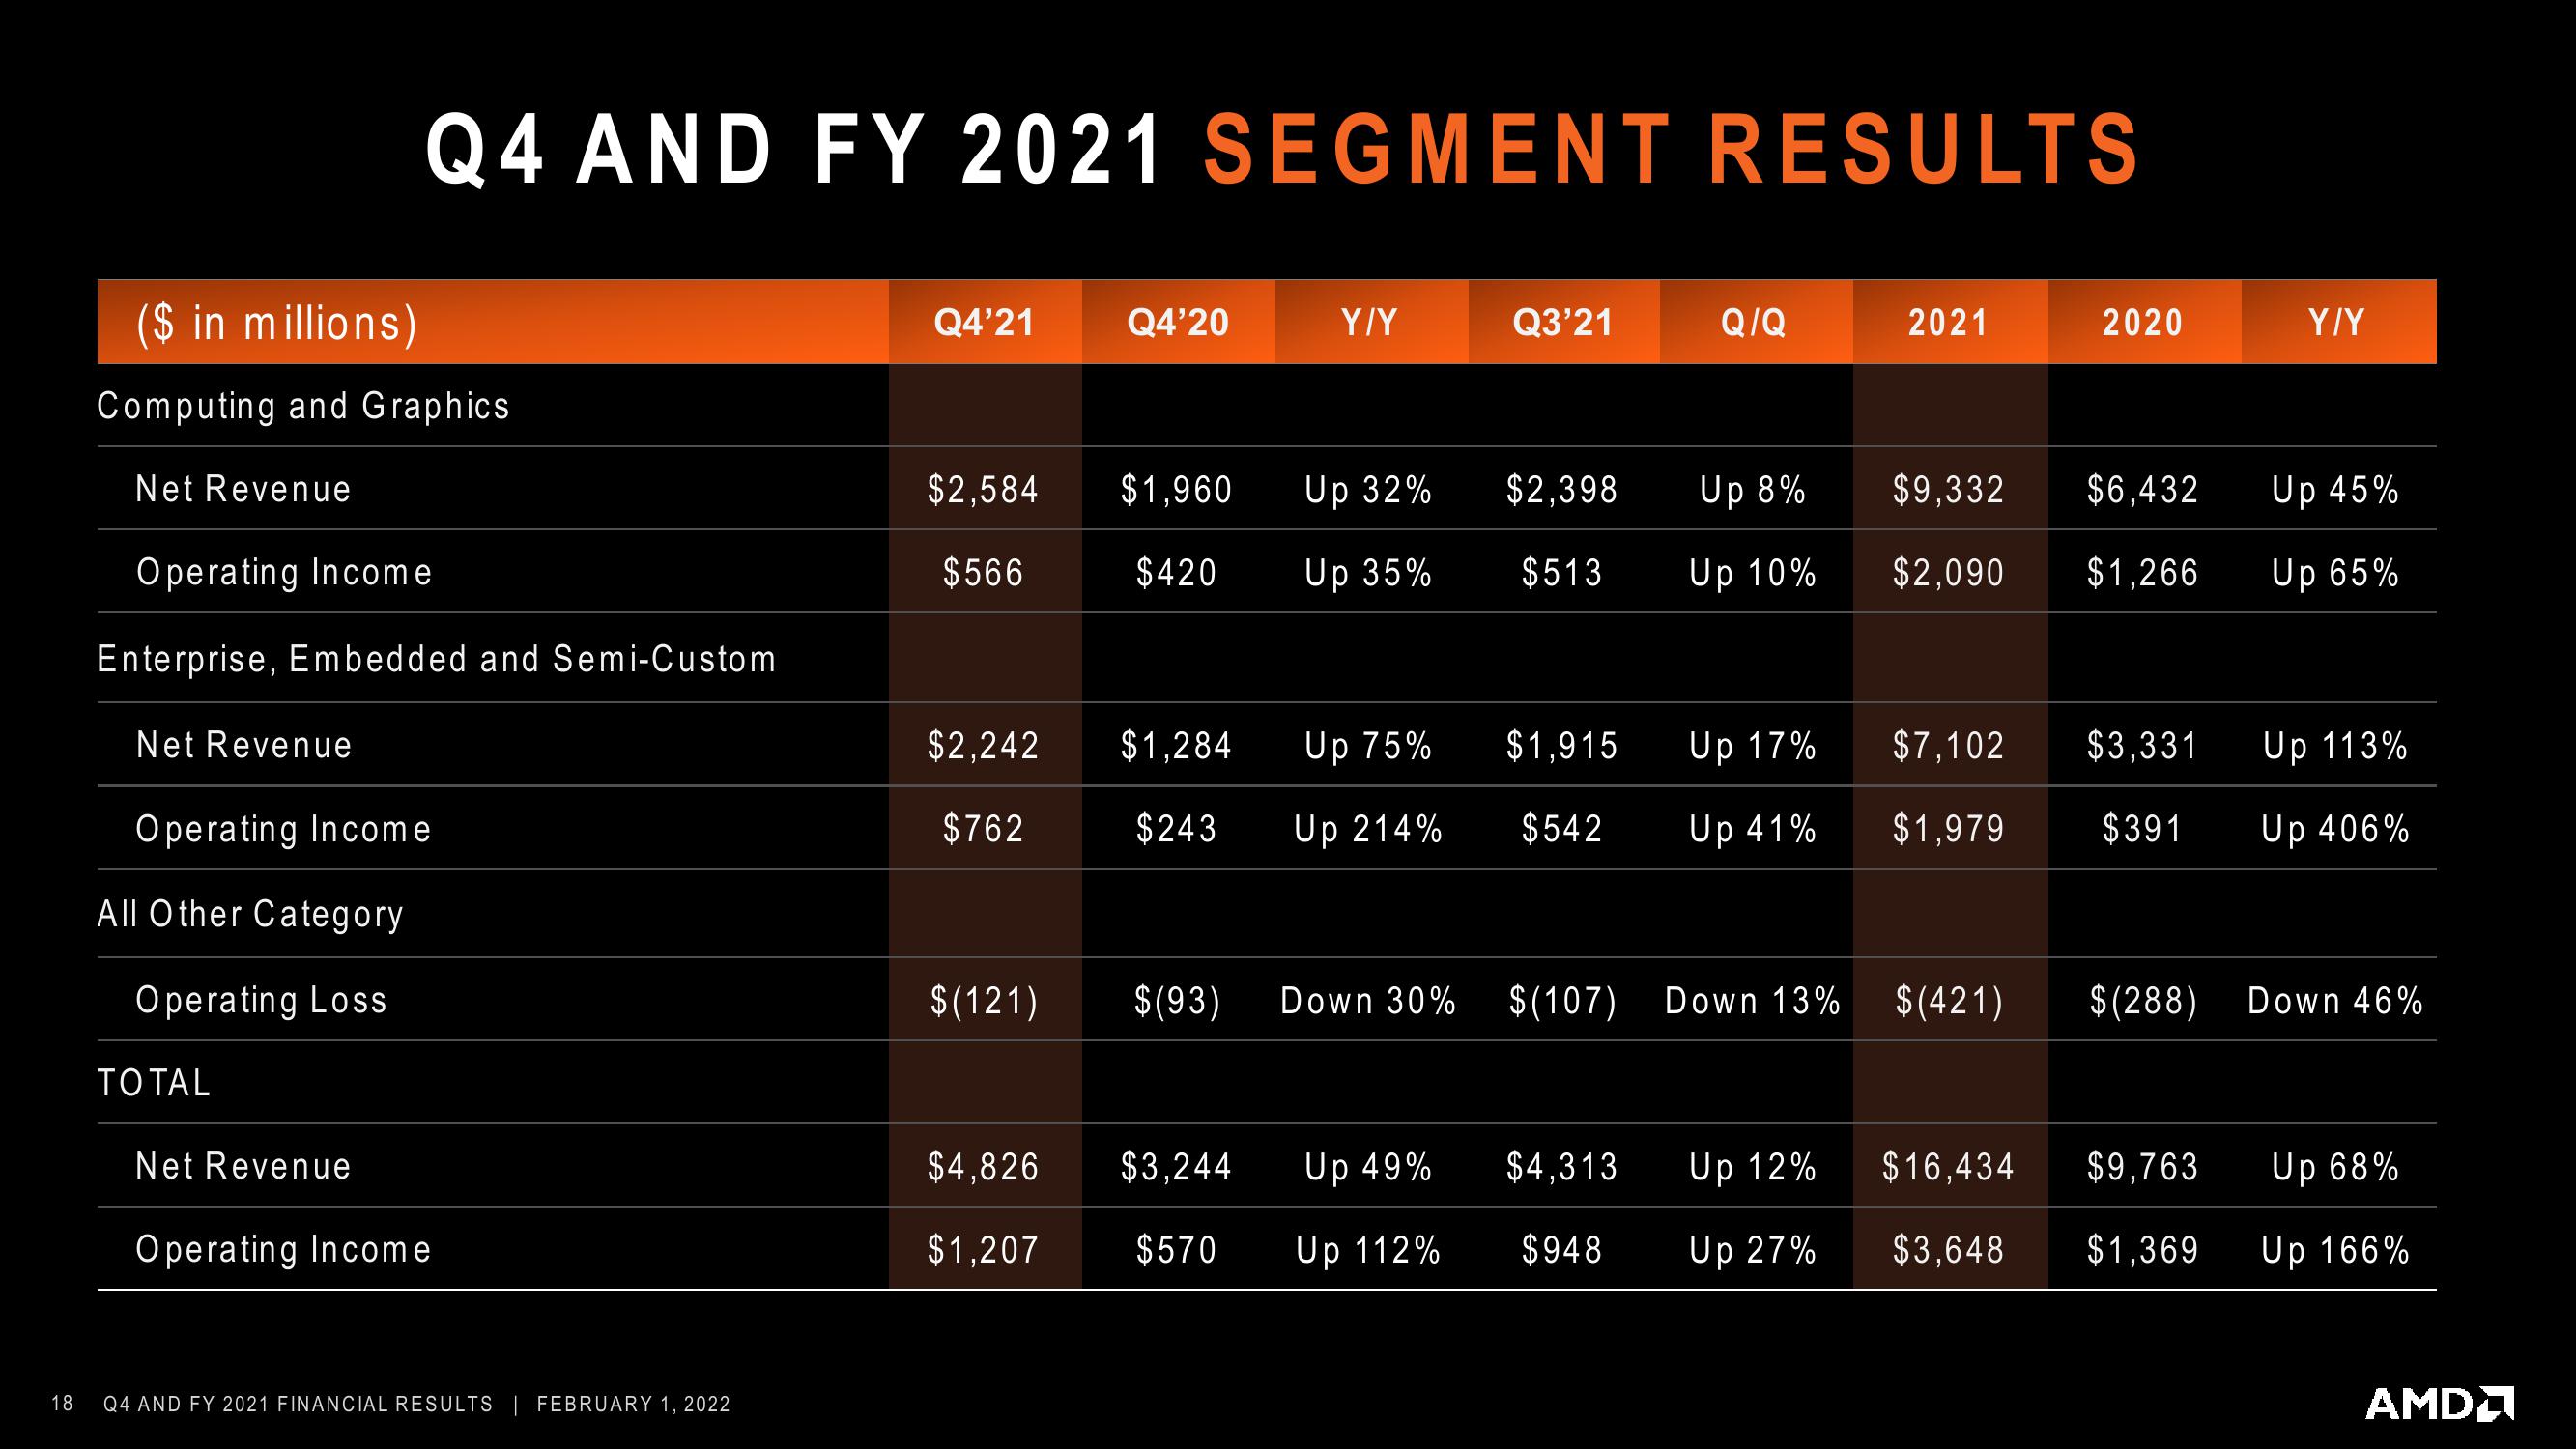
18 ($ in millions) Computing and Graphics Net Revenue Operating Income Enterprise, Embedded and Semi-Custom Net Revenue Q4 AND FY 2021 SEGMENT RESULTS Operating Income All Other Category Operating Loss TOTAL Net Revenue Operating Income Q4 AND FY 2021 FINANCIAL RESULTS | FEBRUARY 1, 2022 Q4'21 $2,584 $566 $2,242 $762 $(121) $4,826 $1,207 Q4'20 $1,960 $420 $1,284 $243 $(93) $3,244 $570 Y/Y Up 32% Up 35% Up 75% Up 214% Down 30% Up 49% Up 112% Q3'21 $2,398 $513 $1,915 $542 Q/Q $4,313 $948 Up 8% Up 10% Up 17% Up 41% $(107) Down 13% Up 12% Up 27% 2021 $9,332 $2,090 $7,102 $1,979 $(421) $16,434 $3,648 2020 $6,432 $1,266 $3,331 $391 $(288) $9,763 $1,369 Y/Y Up 45% Up 65% Up 113% Up 406% Down 46% Up 68% Up 166% AMD
View entire presentation