GlobalFoundries Results Presentation Deck
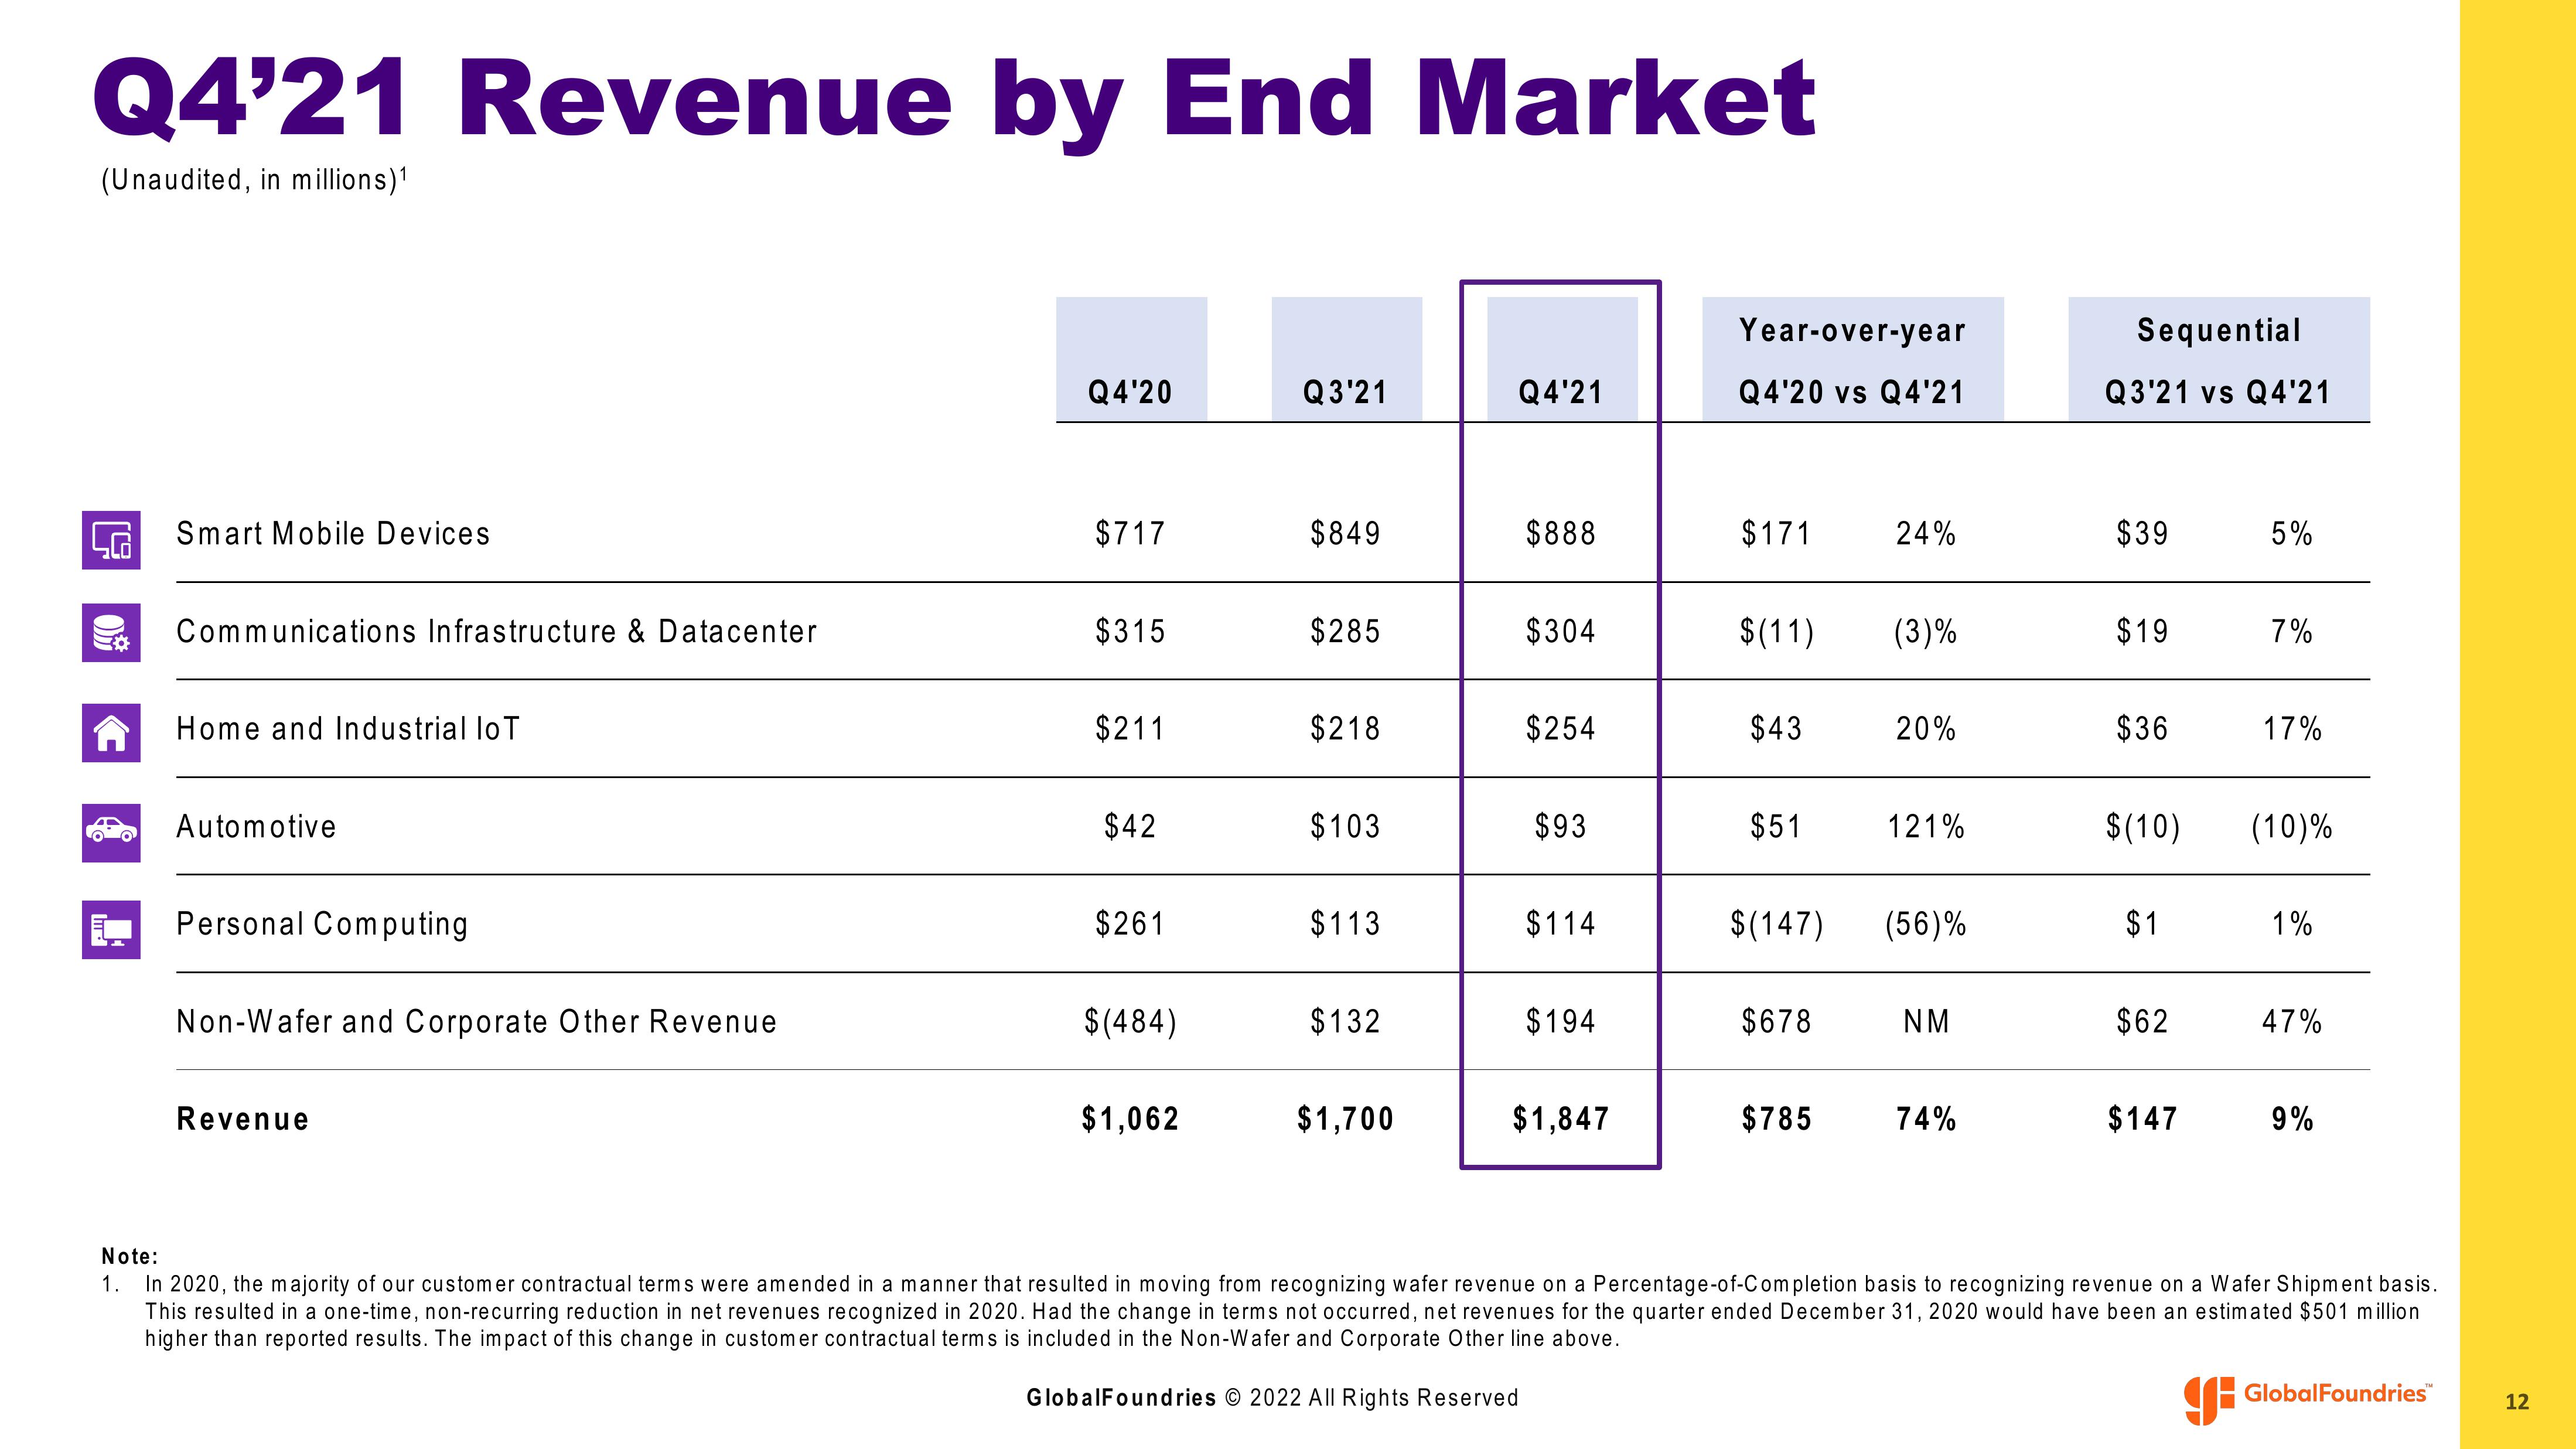
Q4'21 Revenue by End Market
(Unaudited, in millions) ¹
Smart Mobile Devices
Communications Infrastructure & Datacenter
Home and Industrial lo
Automotive
Personal Computing
Non-Wafer and Corporate Other Revenue
Revenue
Q4'20
$717
$315
$211
$42
$261
$(484)
$1,062
Q3'21
$849
$285
$218
$103
$113
$132
$1,700
Q4'21
$888
$304
$254
$93
$114
$194
$1,847
Year-over-year
Q4'20 vs Q4'21
$171
$(11) (3)%
$43
$51
24%
$678
$785
20%
$(147) (56)%
121%
NM
74%
Sequential
Q3'21 vs Q4'21
$39
$19
$36
$(10)
$1
$62
$147
5%
7%
17%
(10)%
1%
47%
9%
Note:
1.
In 2020, the majority of our customer contractual terms were amended in a manner that resulted in moving from recognizing wafer revenue on a Percentage-of-Completion basis to recognizing revenue on a Wafer Shipment basis.
This resulted in a one-time, non-recurring reduction in net revenues recognized in 2020. Had the change in terms not occurred, net revenues for the quarter ended December 31, 2020 would have been an estimated $501 million
higher than reported results. The impact of this change in customer contractual terms is included the Non-Wafer and Corporate Other line above.
GlobalFoundries © 2022 All Rights Reserved
GlobalFoundries™
12View entire presentation