Q4 & FY 2021 Financial Results
Q4 Consolidated Results
($ in million), except
per share data
Performance Coatings
Mobility Coatings
Net Sales
Financial Performance
Income from operations
Adjusted EBIT
% margin
Diluted EPS
Adjusted EPS
$1,075
Q4 2020
(0.5)%
Volume
2021
804
333
1,137
95
121
10.6 %
$
0.23
$ 0.30 $
Q4
3.6%
Price
2020
0.30
0.58
Net Sales Variance
704
371
1,075
163
205
19.1%
(1.2)%
FX
% Change
Incl. FX
14.2 %
(10.1)%
5.8 %
(42.0)%
(41.1)%
(23.3)%
(48.3)%
3.9%
Excl. FX
15.6 %
(9.3)%
7.0%
5.8%
$1,137
Acq. Q4 2021
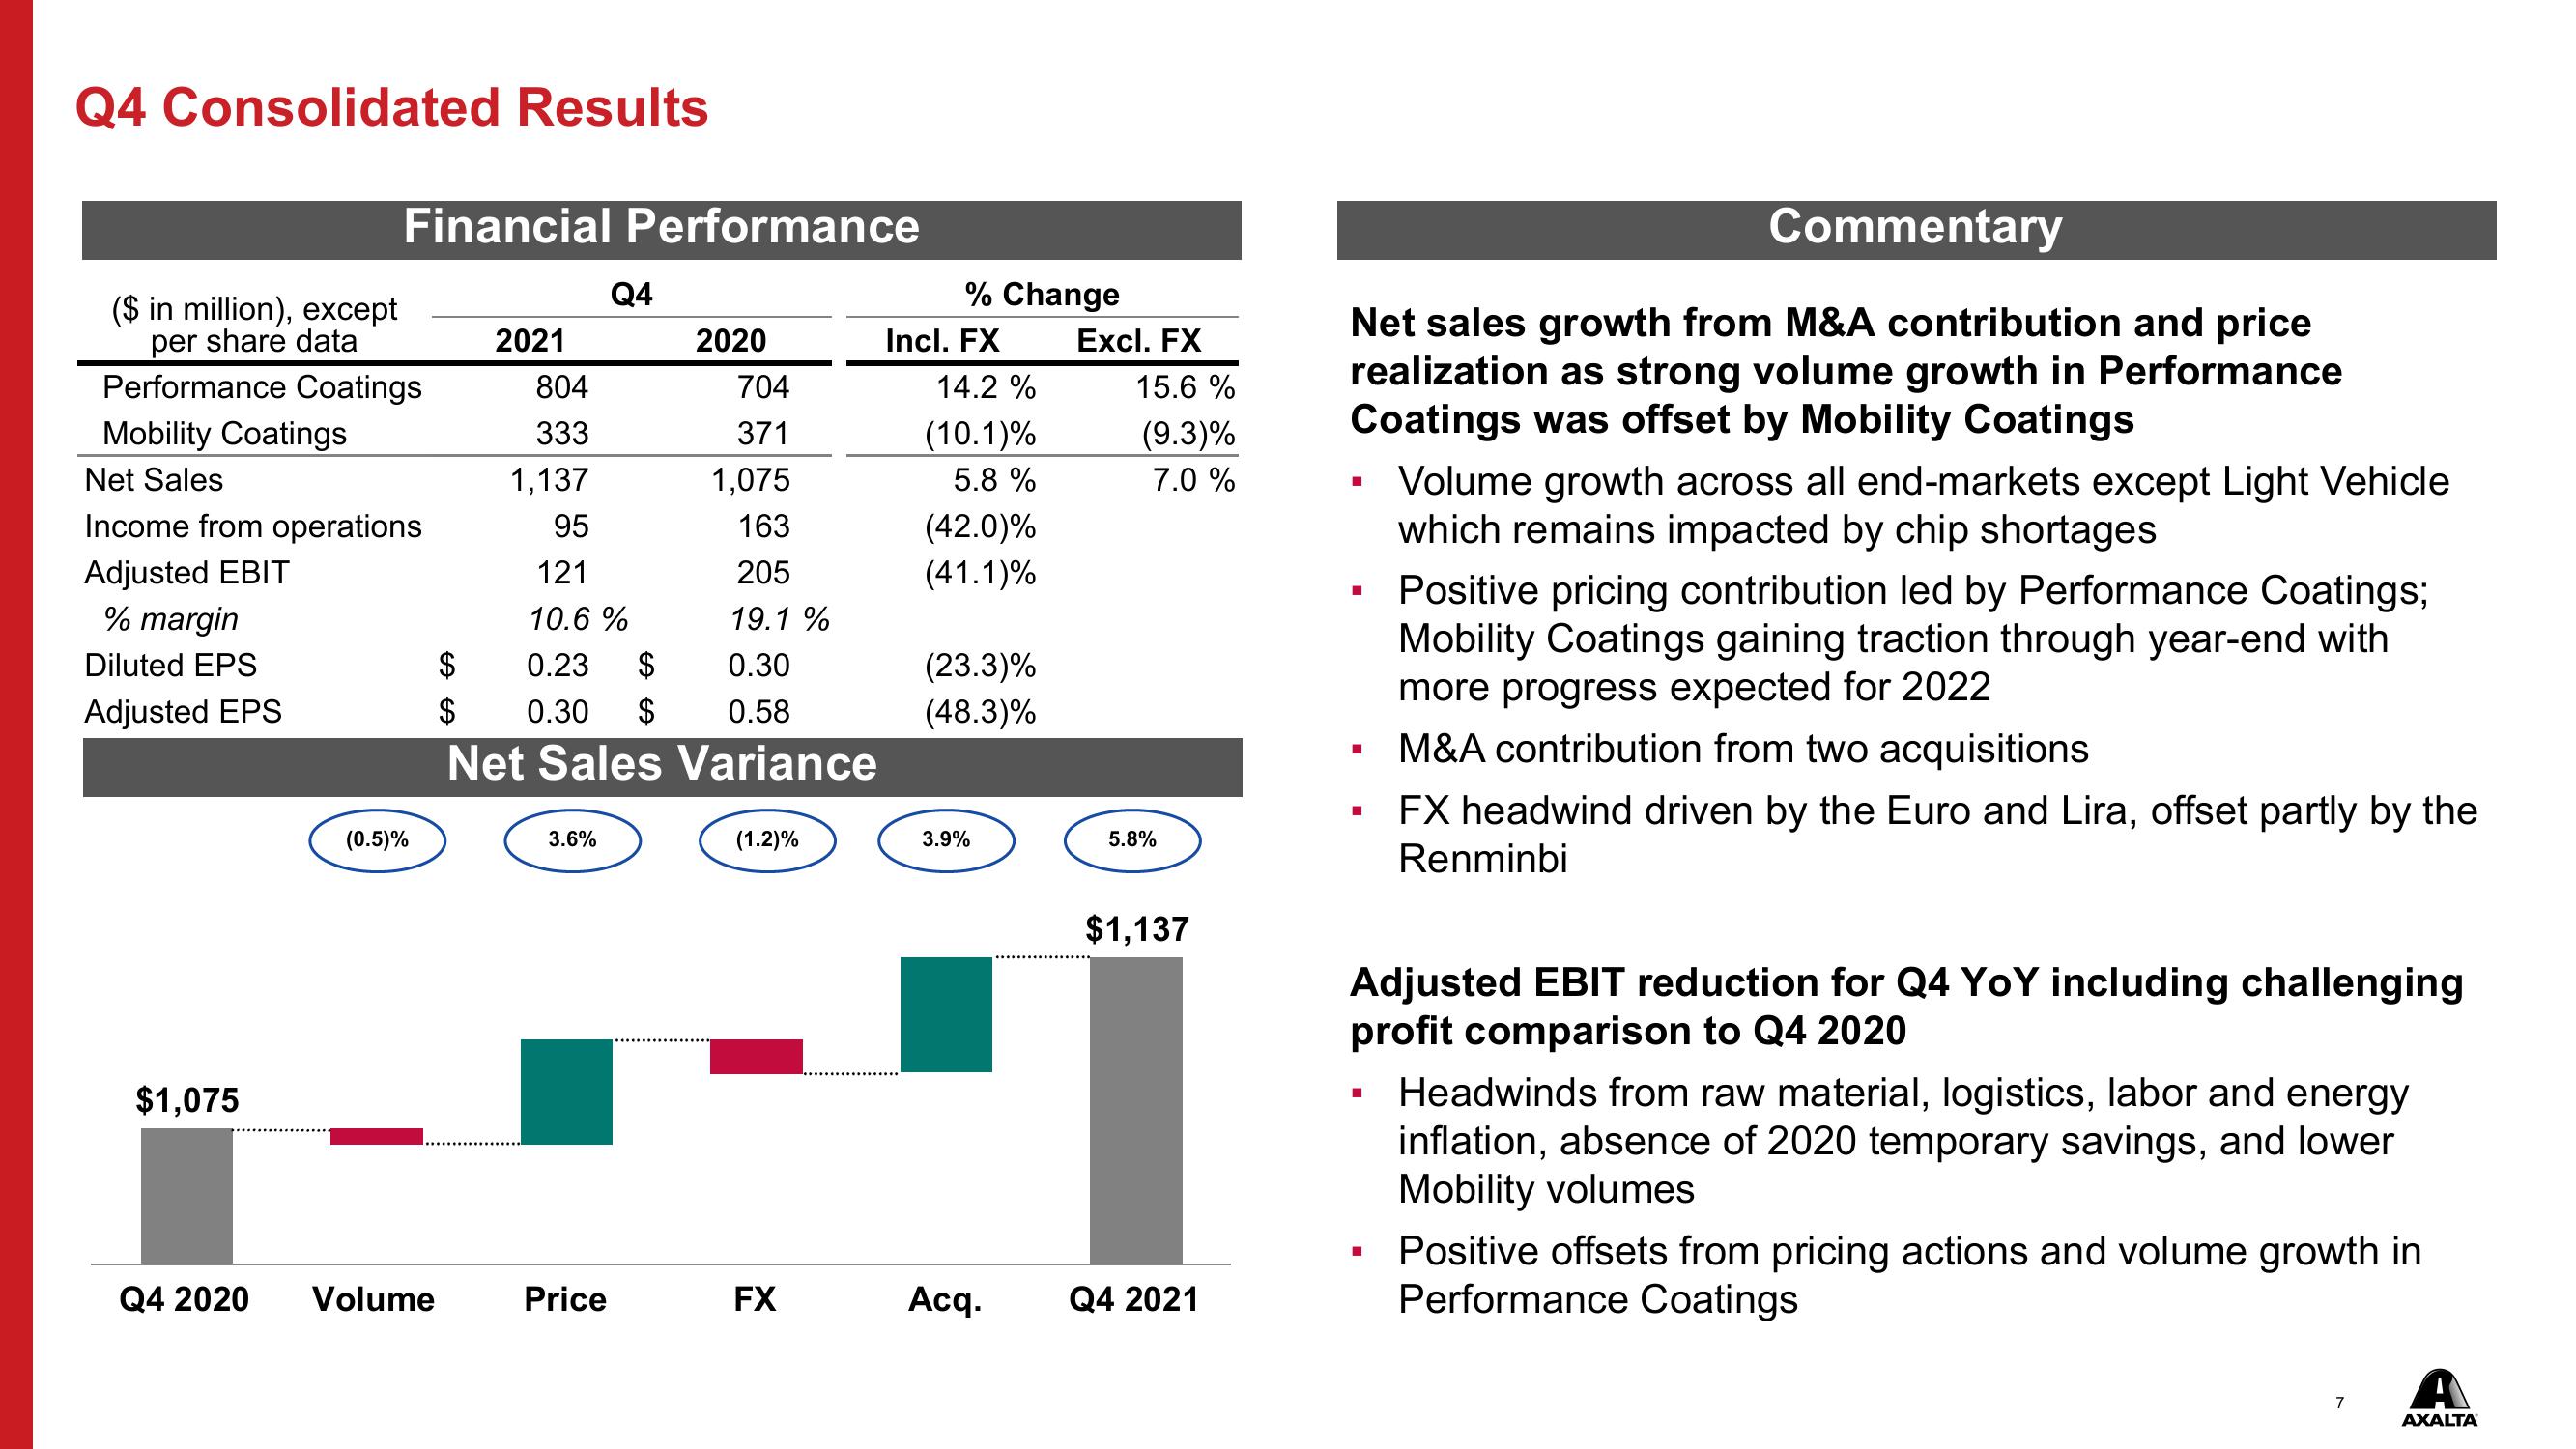
Net sales growth from M&A contribution and price
realization as strong volume growth in Performance
Coatings was offset by Mobility Coatings
I
I
Commentary
I
Volume growth across all end-markets except Light Vehicle
which remains impacted by chip shortages
Positive pricing contribution led by Performance Coatings;
Mobility Coatings gaining traction through year-end with
more progress expected for 2022
M&A contribution from two acquisitions
FX headwind driven by the Euro and Lira, offset partly by the
Renminbi
Adjusted EBIT reduction for Q4 YoY including challenging
profit comparison to Q4 2020
Headwinds from raw material, logistics, labor and energy
inflation, absence of 2020 temporary savings, and lower
Mobility volumes
Positive offsets from pricing actions and volume growth in
Performance Coatings
7
A
AXALTAView entire presentation