Silicon Valley Bank Results Presentation Deck
Robust growth in interest-earning assets as deposit inflows drive
significant securities purchases and elevated cash balances
FY'21 key drivers
• Continue to invest excess on-balance sheet liquidity in high-quality
securities - focused on supporting yields and preserving liquidity
and flexibility
●
●
Q4'20 activity
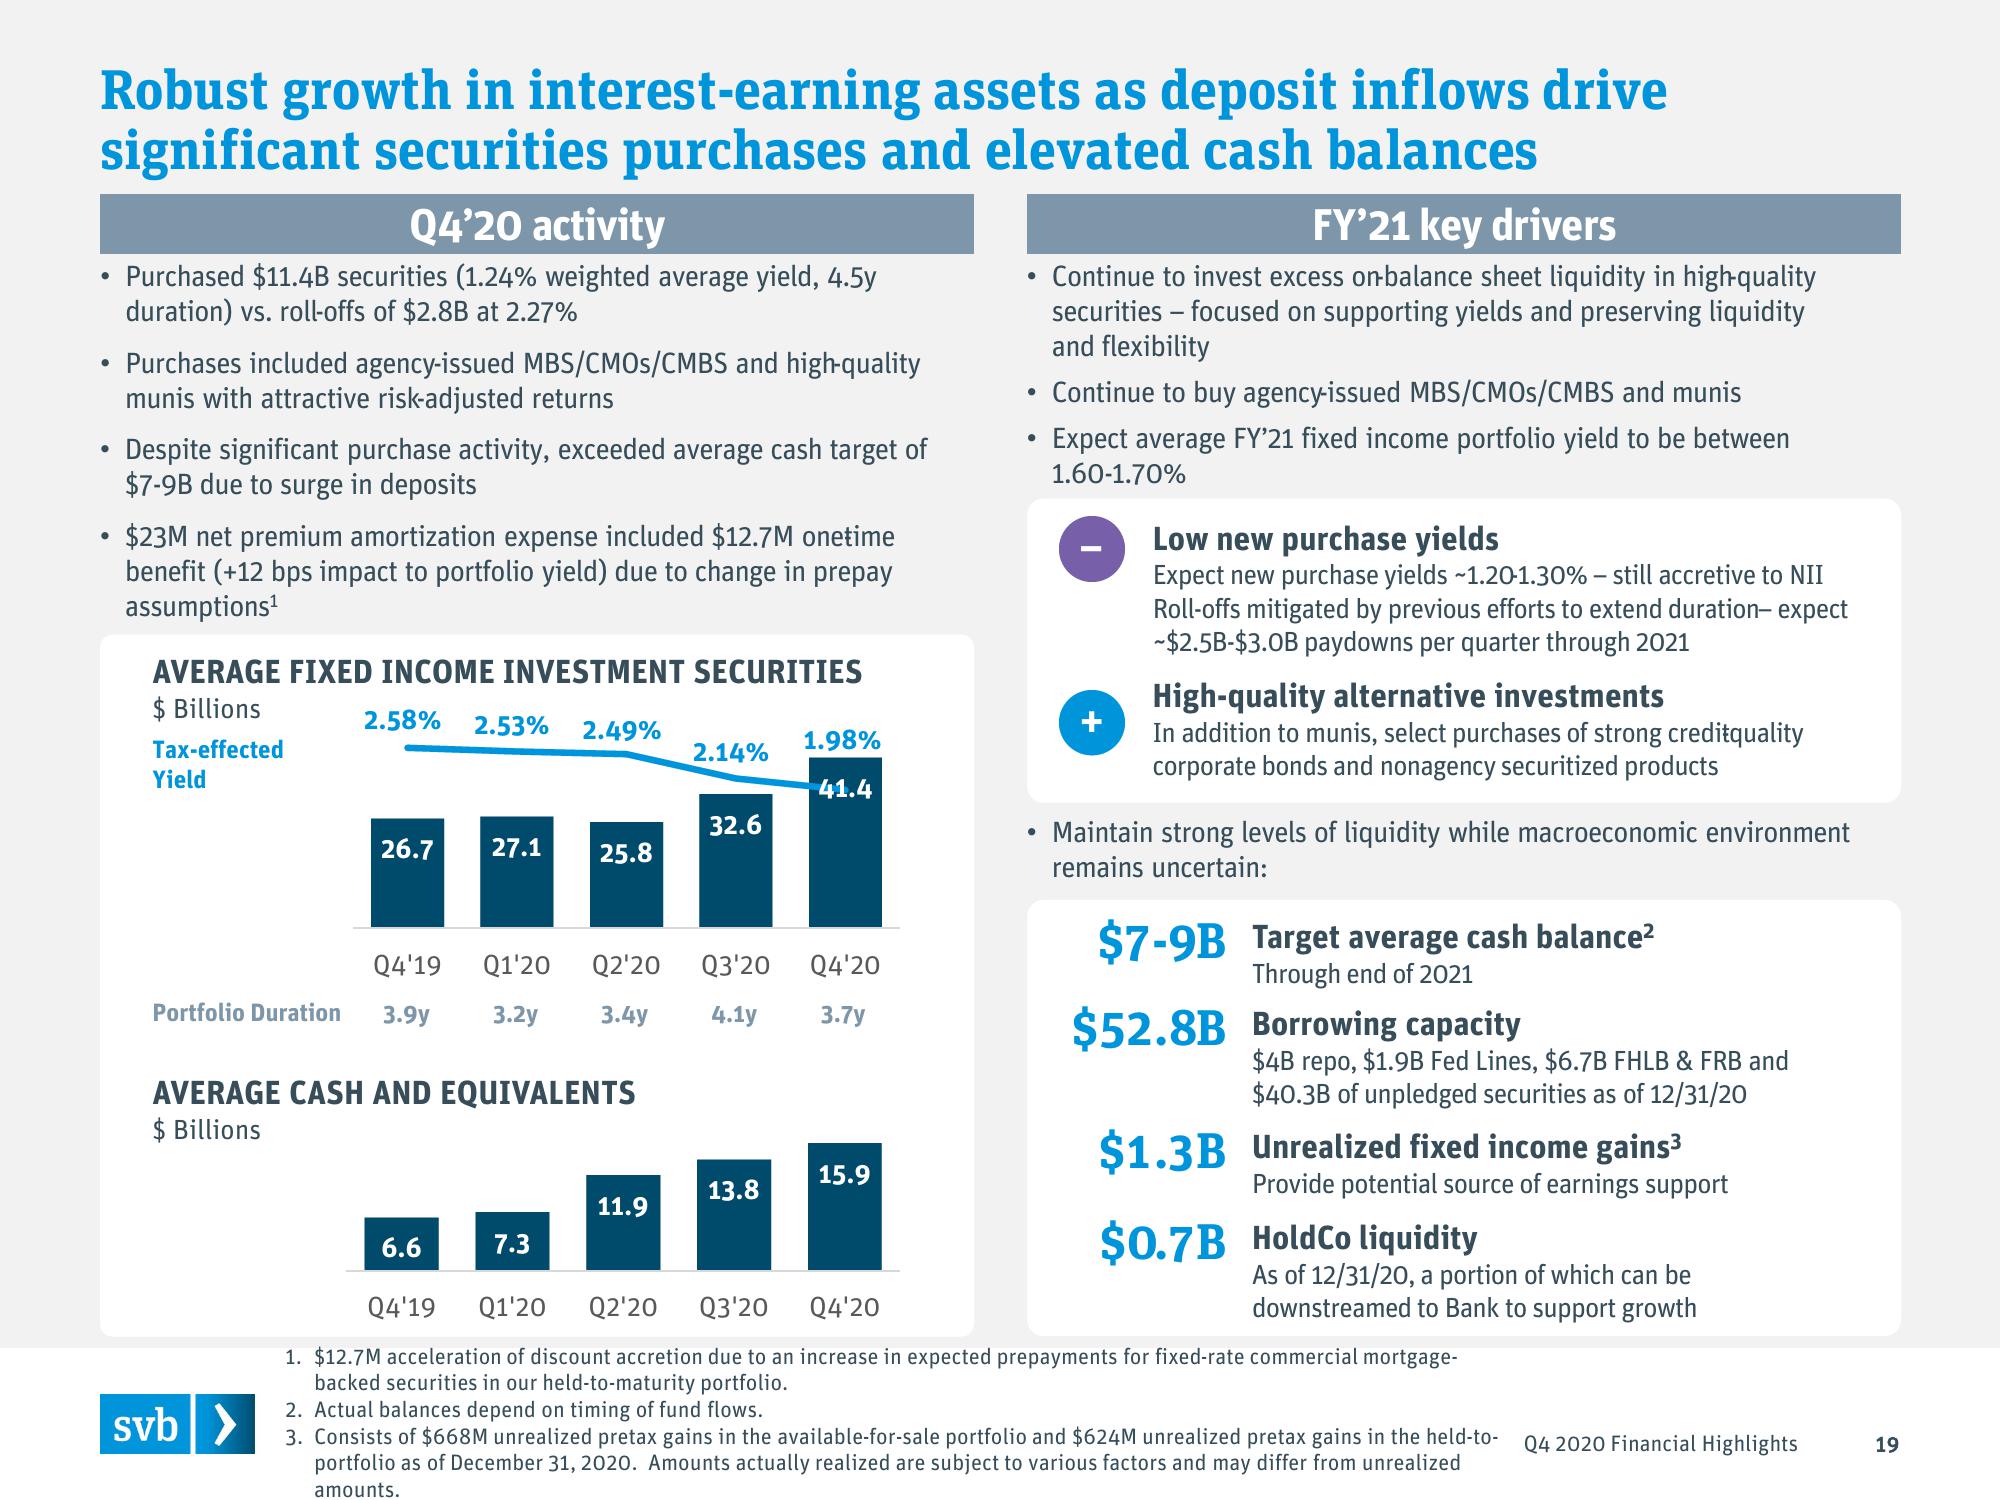
Purchased $11.4B securities (1.24% weighted average yield, 4.5y
duration) vs. roll-offs of $2.8B at 2.27%
Purchases included agency-issued MBS/CMOS/CMBS and high-quality
munis with attractive risk-adjusted returns
Despite significant purchase activity, exceeded average cash target of
$7-9B due to surge in deposits
●
• $23M net premium amortization expense included $12.7M onetime
benefit (+12 bps impact to portfolio yield) due to change in prepay
assumptions¹
AVERAGE FIXED INCOME INVESTMENT SECURITIES
$ Billions
2.58% 2.53% 2.49%
Tax-effected
Yield
26.7 27.1 25.8
Q4'19
Portfolio Duration 3.9y 3.2y
svb >
AVERAGE CASH AND EQUIVALENTS
$ Billions
6.6
Q1'20 Q2'20 Q3'20 Q4'20
3.4y 4.1y
3.7y
7.3
2.14%
11.9
32.6
1.98%
41.4
13.8
15.9
●
●
●
Continue to buy agency-issued MBS/CMOS/CMBS and munis
Expect average FY'21 fixed income portfolio yield to be between
1.60-1.70%
Low new purchase yields
Expect new purchase yields ~1.20-1.30% - still accretive to NII
Roll-offs mitigated by previous efforts to extend duration-expect
-$2.5B-$3.0B paydowns per quarter through 2021
High-quality alternative investments
In addition to munis, select purchases of strong creditquality
corporate bonds and nonagency securitized products
Maintain strong levels of liquidity while macroeconomic environment
remains uncertain:
$7-9B Target average cash balance²
Through end of 2021
$52.8B Borrowing capacity
$4B repo, $1.9B Fed Lines, $6.7B FHLB & FRB and
$40.3B of unpledged securities as of 12/31/20
$1.3B Unrealized fixed income gains³
Provide potential source of earnings support
$0.7B HoldCo liquidity
As of 12/31/20, a portion of which can be
downstreamed to Bank to support growth
Q4'19 Q1'20 Q2'20 Q3'20 Q4'20
1. $12.7M acceleration of discount accretion due to an increase in expected prepayments for fixed-rate commercial mortgage-
backed securities in our held-to-maturity portfolio.
2. Actual balances depend on timing of fund flows.
3. Consists of $668M unrealized pretax gains in the available-for-sale portfolio and $624M unrealized pretax gains in the held-to-
portfolio as of December 31, 2020. Amounts actually realized are subject to various factors and may differ from unrealized
amounts.
Q4 2020 Financial Highlights
19View entire presentation