Markforged SPAC Presentation Deck
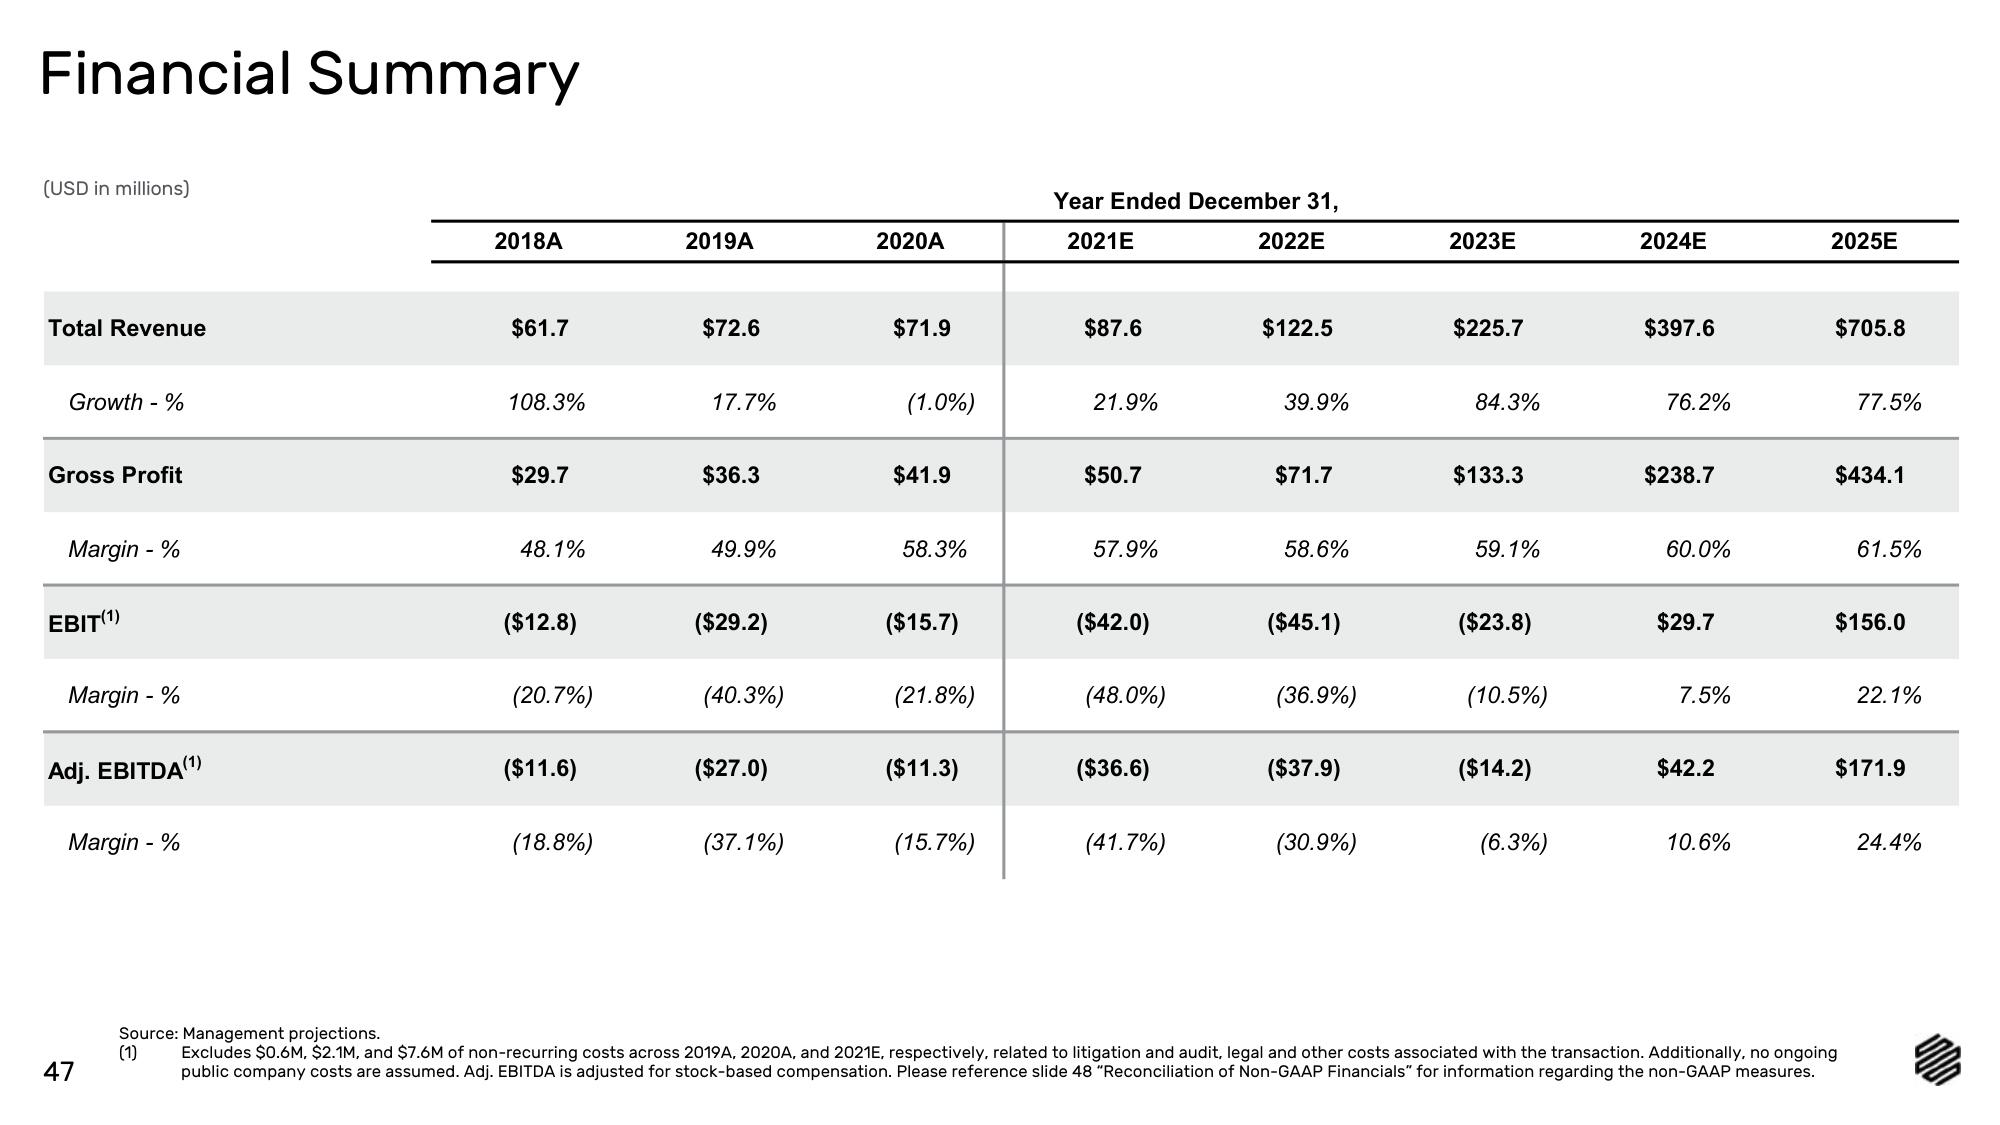
Financial Summary
(USD in millions)
Total Revenue
Growth - %
Gross Profit
Margin - %
EBIT(1¹)
Margin - %
Adj. EBITDA (1)
Margin - %
47
2018A
$61.7
108.3%
$29.7
48.1%
($12.8)
(20.7%)
($11.6)
(18.8%)
2019A
$72.6
17.7%
$36.3
49.9%
($29.2)
(40.3%)
($27.0)
(37.1%)
2020A
$71.9
(1.0%)
$41.9
58.3%
($15.7)
(21.8%)
($11.3)
(15.7%)
Year Ended December 31,
2021E
2022E
$87.6
21.9%
$50.7
57.9%
($42.0)
(48.0%)
($36.6)
(41.7%)
$122.5
39.9%
$71.7
58.6%
($45.1)
(36.9%)
($37.9)
(30.9%)
2023E
$225.7
84.3%
$133.3
59.1%
($23.8)
(10.5%)
($14.2)
(6.3%)
2024E
$397.6
76.2%
$238.7
60.0%
$29.7
7.5%
$42.2
10.6%
2025E
$705.8
77.5%
$434.1
61.5%
$156.0
Source: Management projections.
(1)
Excludes $0.6M, $2.1M, and $7.6M of non-recurring costs across 2019A, 2020A, and 2021E, respectively, related to litigation and audit, legal and other costs associated with the transaction. Additionally, no ongoing
public company costs are assumed. Adj. EBITDA is adjusted for stock-based compensation. Please reference slide 48 "Reconciliation of Non-GAAP Financials" for information regarding the non-GAAP measures.
22.1%
$171.9
24.4%View entire presentation