XP Inc Results Presentation Deck
Retail Revenue and New Verticals
Retail Revenue (in R$ mn)
1,844
4Q20
+48%
2,599
3Q21
2,725
4Q21
Highlights
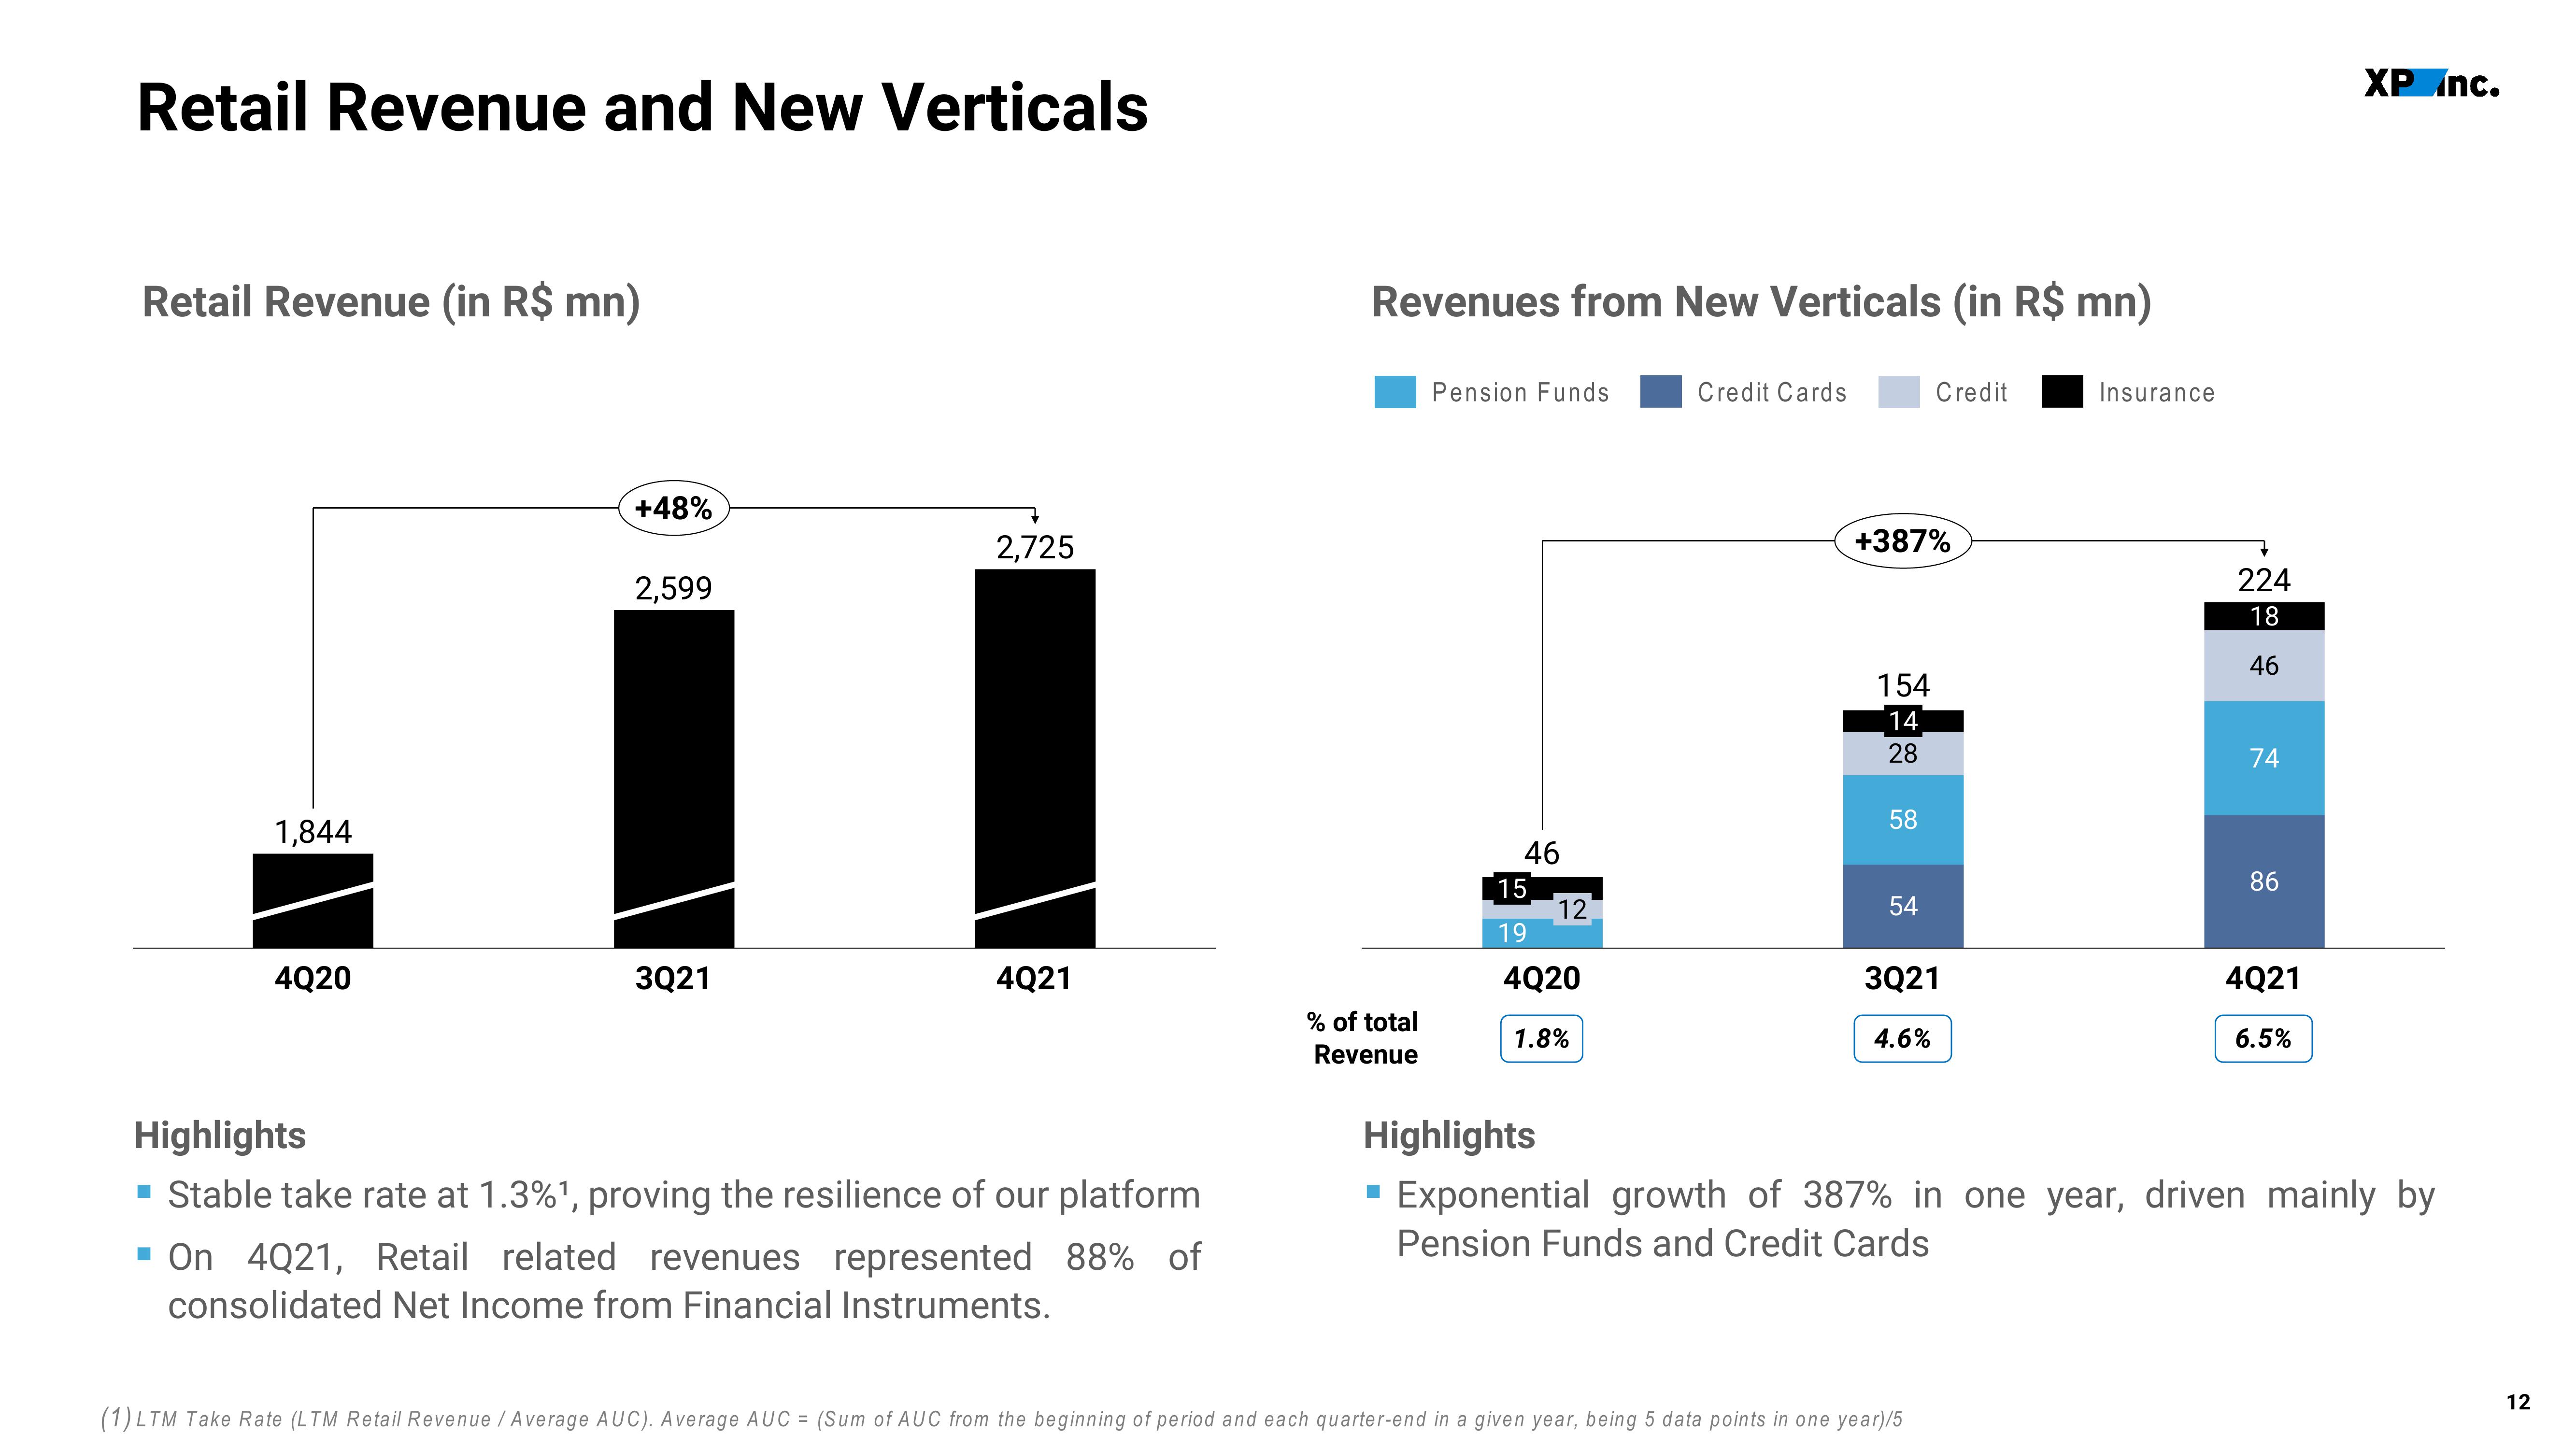
▪ Stable take rate at 1.3% ¹, proving the resilience of our platform
▪ On 4Q21, Retail related revenues represented 88% of
consolidated Net Income from Financial Instruments.
Revenues from New Verticals (in R$ mn)
% of total
Revenue
Pension Funds
■
46
15
19
4Q20
1.8%
12
Credit Cards
+387%
154
14
28
58
54
Credit
3Q21
4.6%
(1) LTM Take Rate (LTM Retail Revenue / Average AUC). Average AUC = (Sum of AUC from the beginning of period and each quarter-end in a given year, being 5 data points in one year)/5
Insurance
7
224
18
46
74
86
4Q21
6.5%
Highlights
Exponential growth of 387% in one year, driven mainly by
Pension Funds and Credit Cards
XP Inc.
12View entire presentation