Advent SPAC Presentation Deck
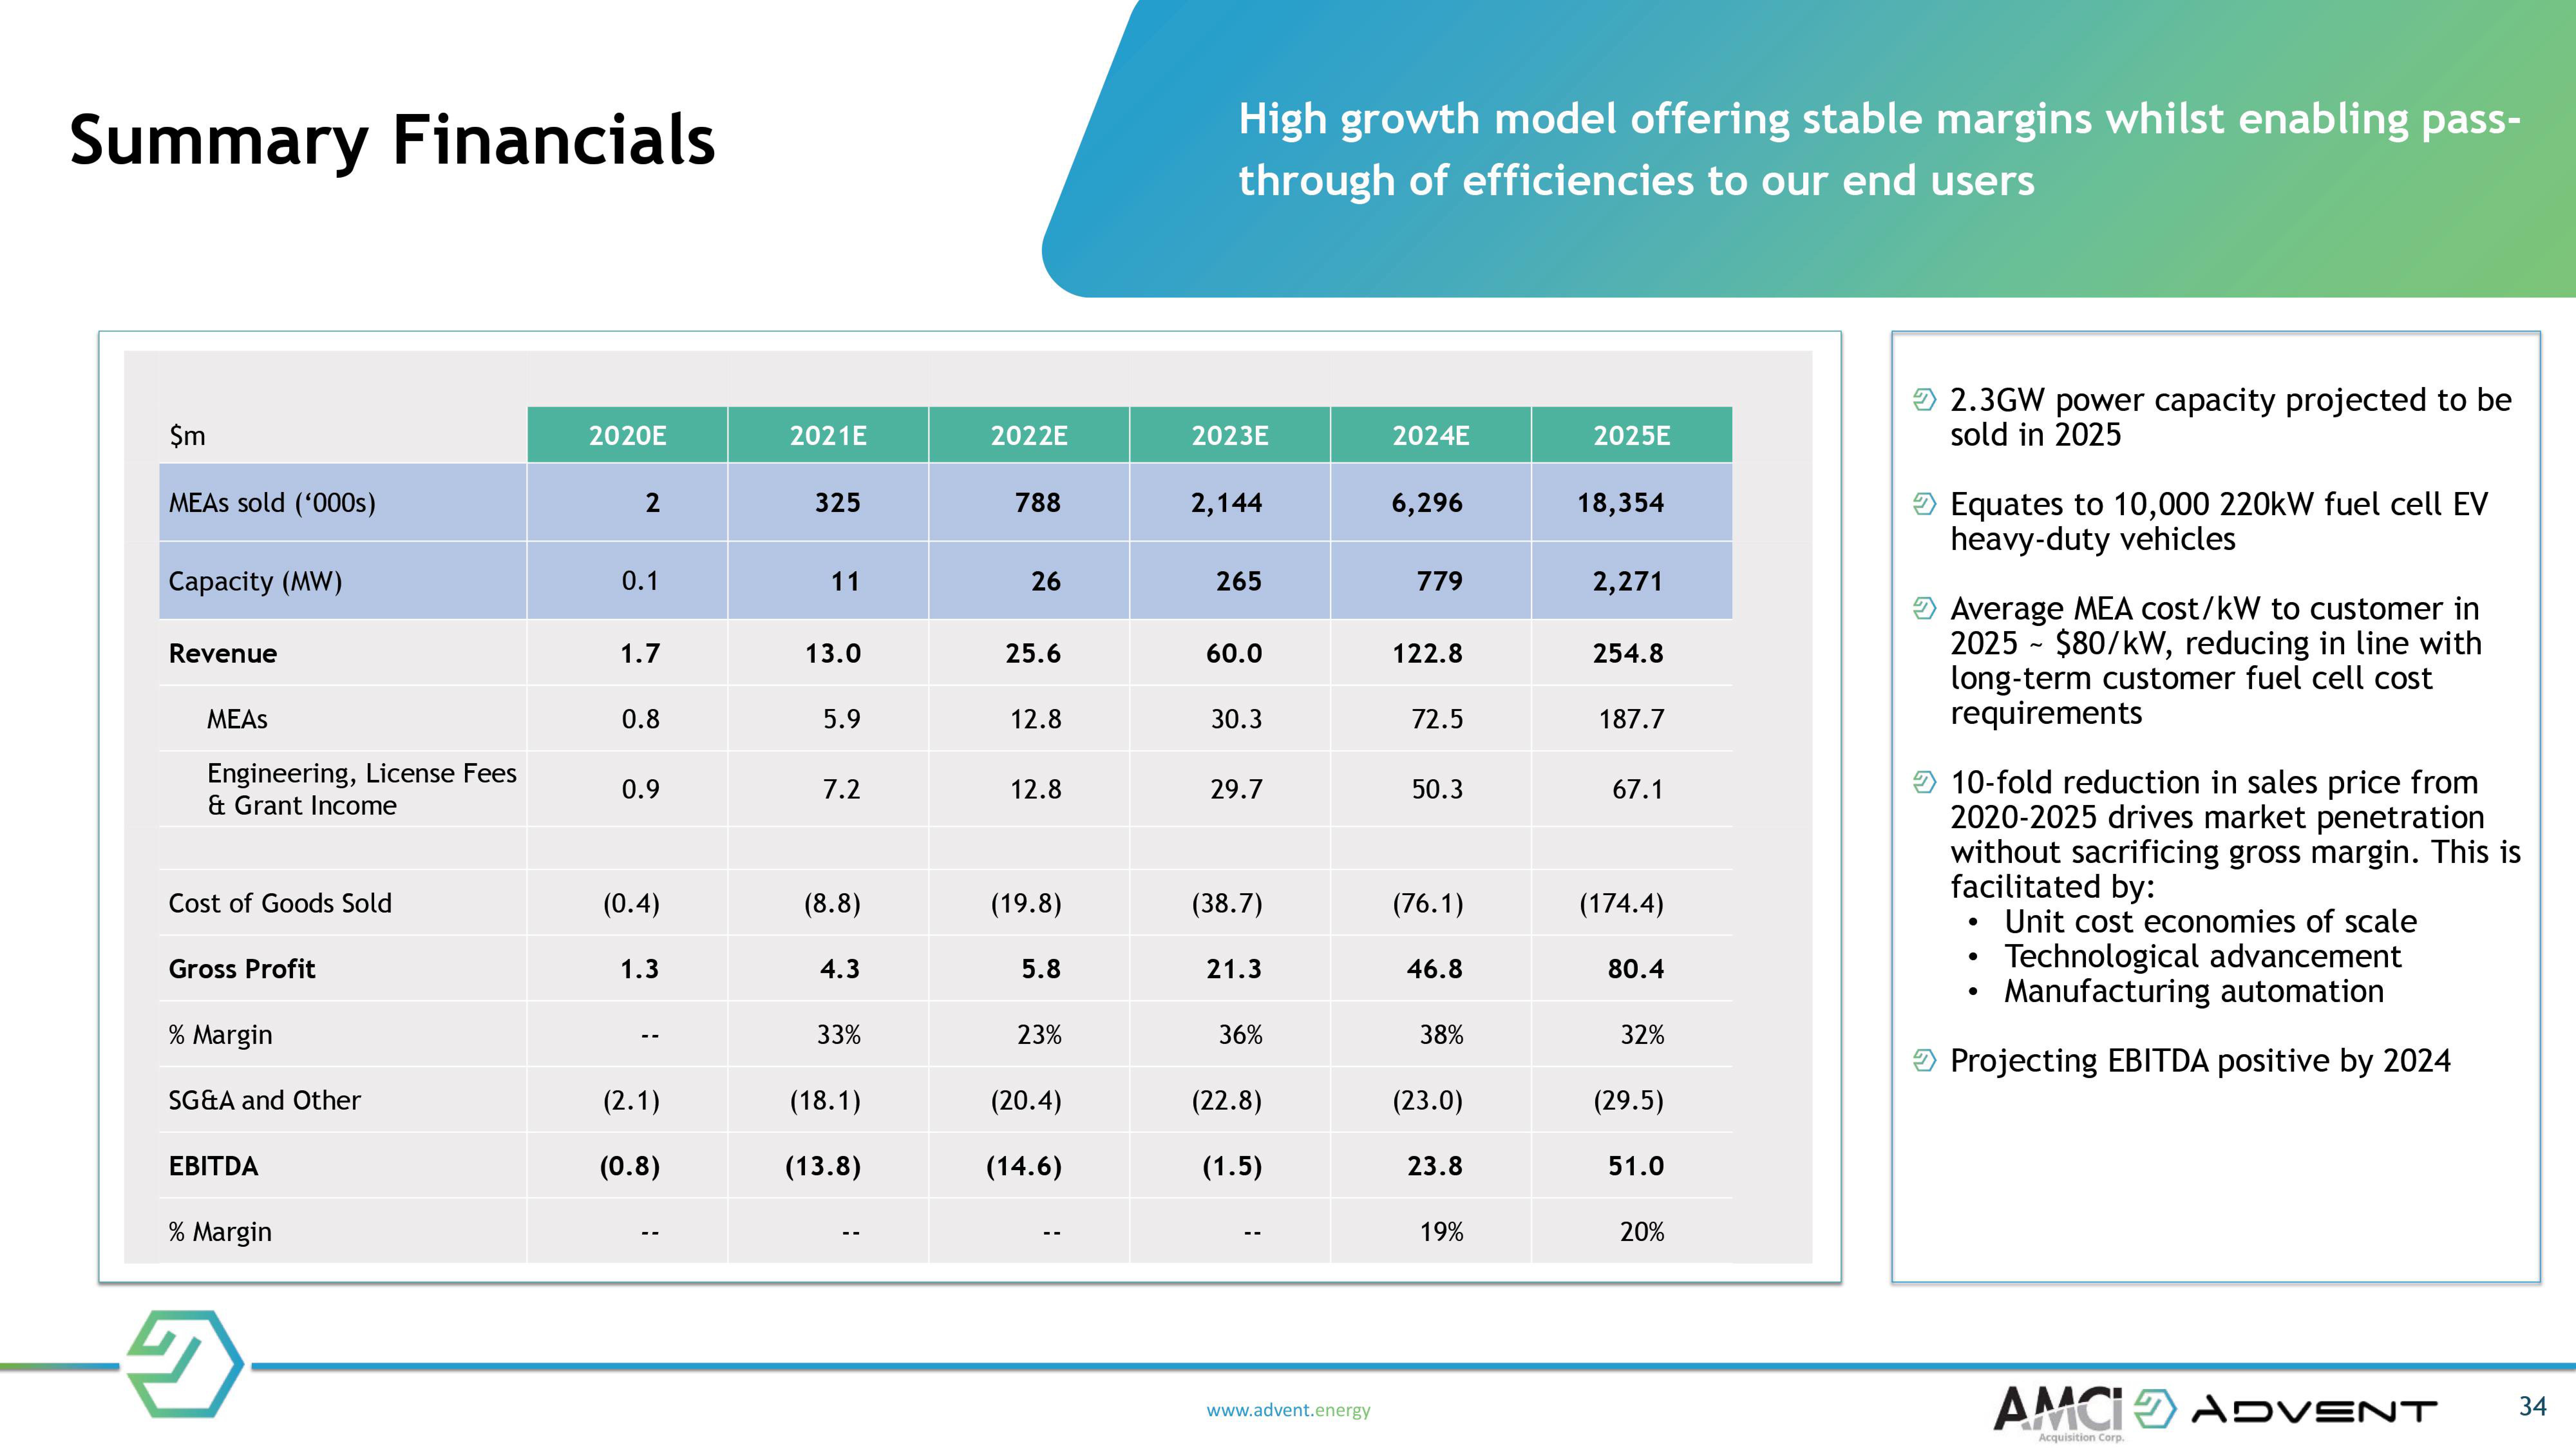
Summary Financials
$m
MEAS sold ('000s)
Capacity (MW)
Revenue
MEAS
Engineering, License Fees
& Grant Income
Cost of Goods Sold
Gross Profit
% Margin
SG&A and Other
EBITDA
% Margin
2020E
2
0.1
1.7
0.8
0.9
(0.4)
1.3
(2.1)
(0.8)
2021E
325
11
13.0
5.9
7.2
(8.8)
4.3
33%
(18.1)
(13.8)
2022E
788
26
25.6
12.8
12.8
(19.8)
5.8
23%
(20.4)
(14.6)
High growth model offering stable margins whilst enabling pass-
through of efficiencies to our end users
2023E
2,144
265
60.0
30.3
29.7
(38.7)
21.3
36%
(22.8)
(1.5)
www.advent.energy
2024E
6,296
779
122.8
72.5
50.3
(76.1)
46.8
38%
(23.0)
23.8
19%
2025E
18,354
2,271
254.8
187.7
67.1
(174.4)
80.4
32%
(29.5)
51.0
20%
2.3GW power capacity projected to be
sold in 2025
Equates to 10,000 220kW fuel cell EV
heavy-duty vehicles
Average MEA cost/kW to customer in
2025 $80/kW, reducing in line with
long-term customer fuel cell cost
requirements
10-fold reduction in sales price from
2020-2025 drives market penetration
without sacrificing gross margin. This is
facilitated by:
Unit cost economies of scale
●
Technological advancement
Manufacturing automation
Projecting EBITDA positive by 2024
●
●
AMCI ADVENT
Acquisition Corp.
34View entire presentation