Avantor Results Presentation Deck
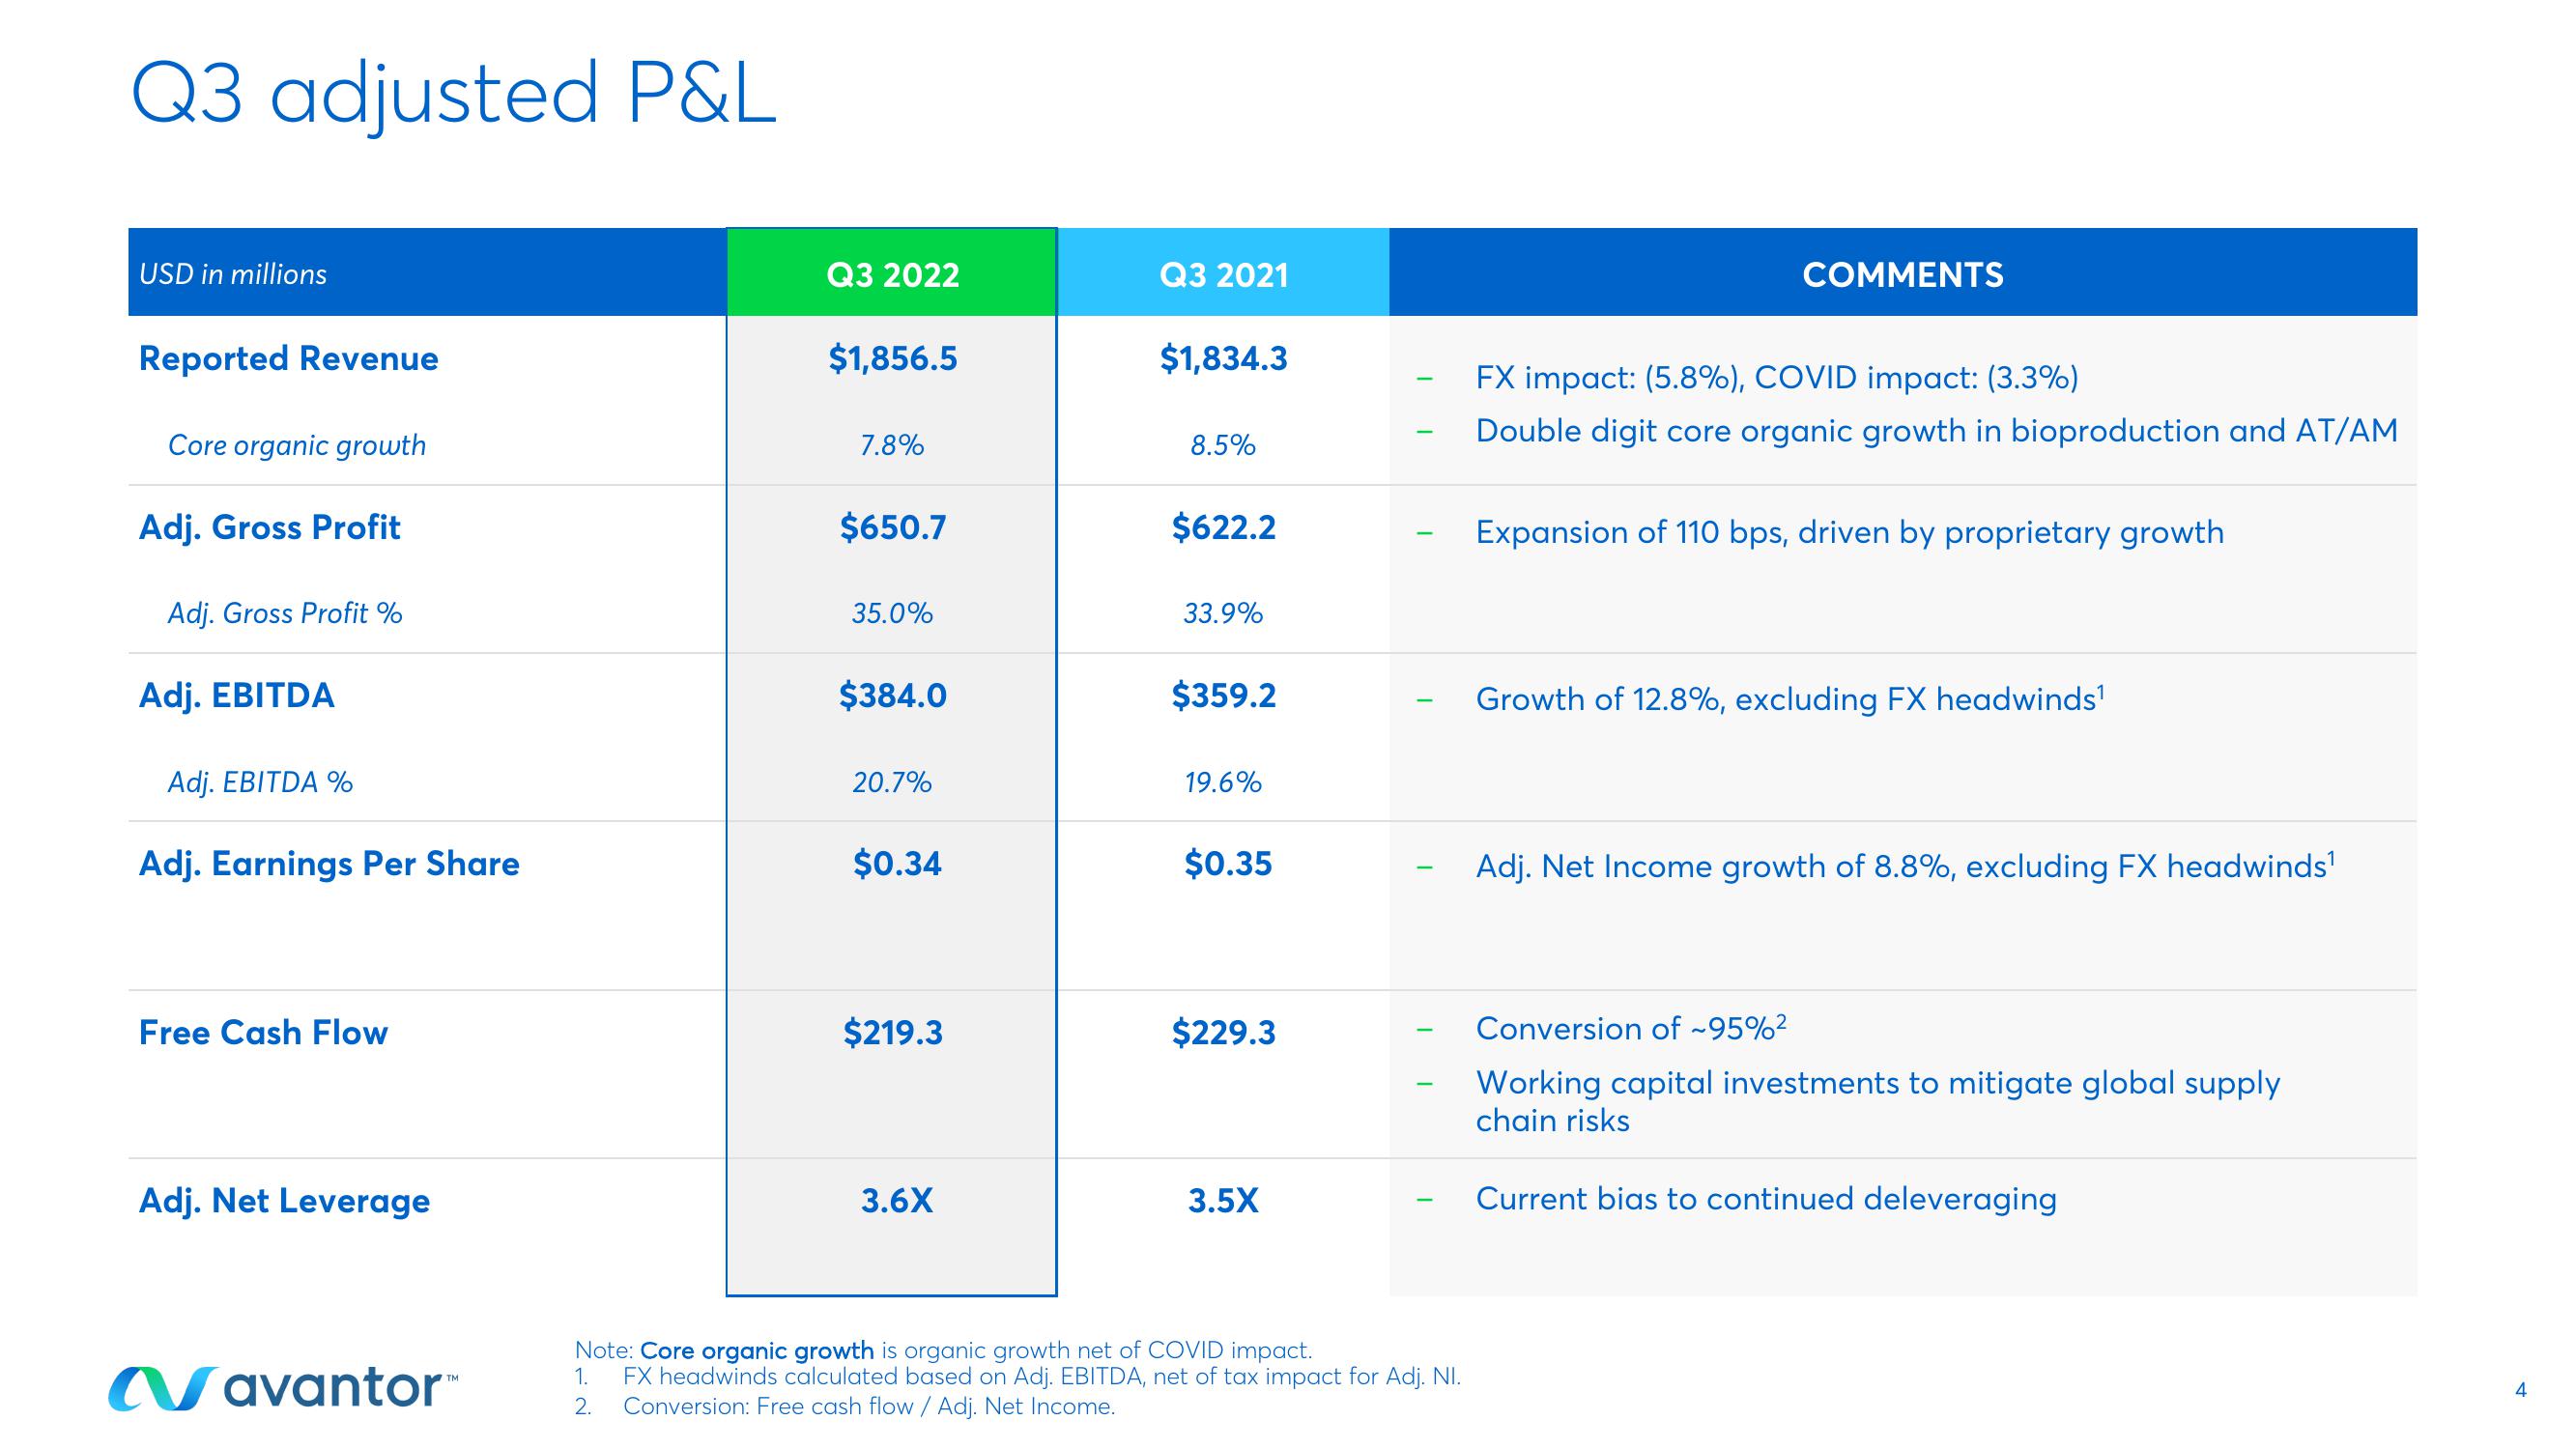
Q3 adjusted P&L
USD in millions
Reported Revenue
Core organic growth
Adj. Gross Profit
Adj. Gross Profit %
Adj. EBITDA
Adj. EBITDA %
Adj. Earnings Per Share
Free Cash Flow
Adj. Net Leverage
Navantor™
Q3 2022
$1,856.5
7.8%
$650.7
35.0%
$384.0
20.7%
$0.34
$219.3
3.6X
Q3 2021
$1,834.3
8.5%
$622.2
33.9%
$359.2
19.6%
$0.35
$229.3
3.5X
-
-
Note: Core organic growth is organic growth net of COVID impact.
1.
FX headwinds calculated based on Adj. EBITDA, net of tax impact for Adj. NI.
2. Conversion: Free cash flow / Adj. Net Income.
COMMENTS
FX impact: (5.8%), COVID impact: (3.3%)
Double digit core organic growth in bioproduction and AT/AM
Expansion of 110 bps, driven by proprietary growth
Growth of 12.8%, excluding FX headwinds¹
Adj. Net Income growth of 8.8%, excluding FX headwinds¹
Conversion of ~95%²
Working capital investments to mitigate global supply
chain risks
Current bias to continued deleveraging
4View entire presentation