Overview of Content Accounting
Revenues
Cost of revenues
Marketing
Technology and development
General and administrative
Operating income
Other income (expense):
Interest expense
Interest and other income (expense)
Income before income taxes
Provision for income taxes
Net income
Earnings per share:
Basic
Diluted
Weighted-average common shares outstanding:
Basic
Diluted
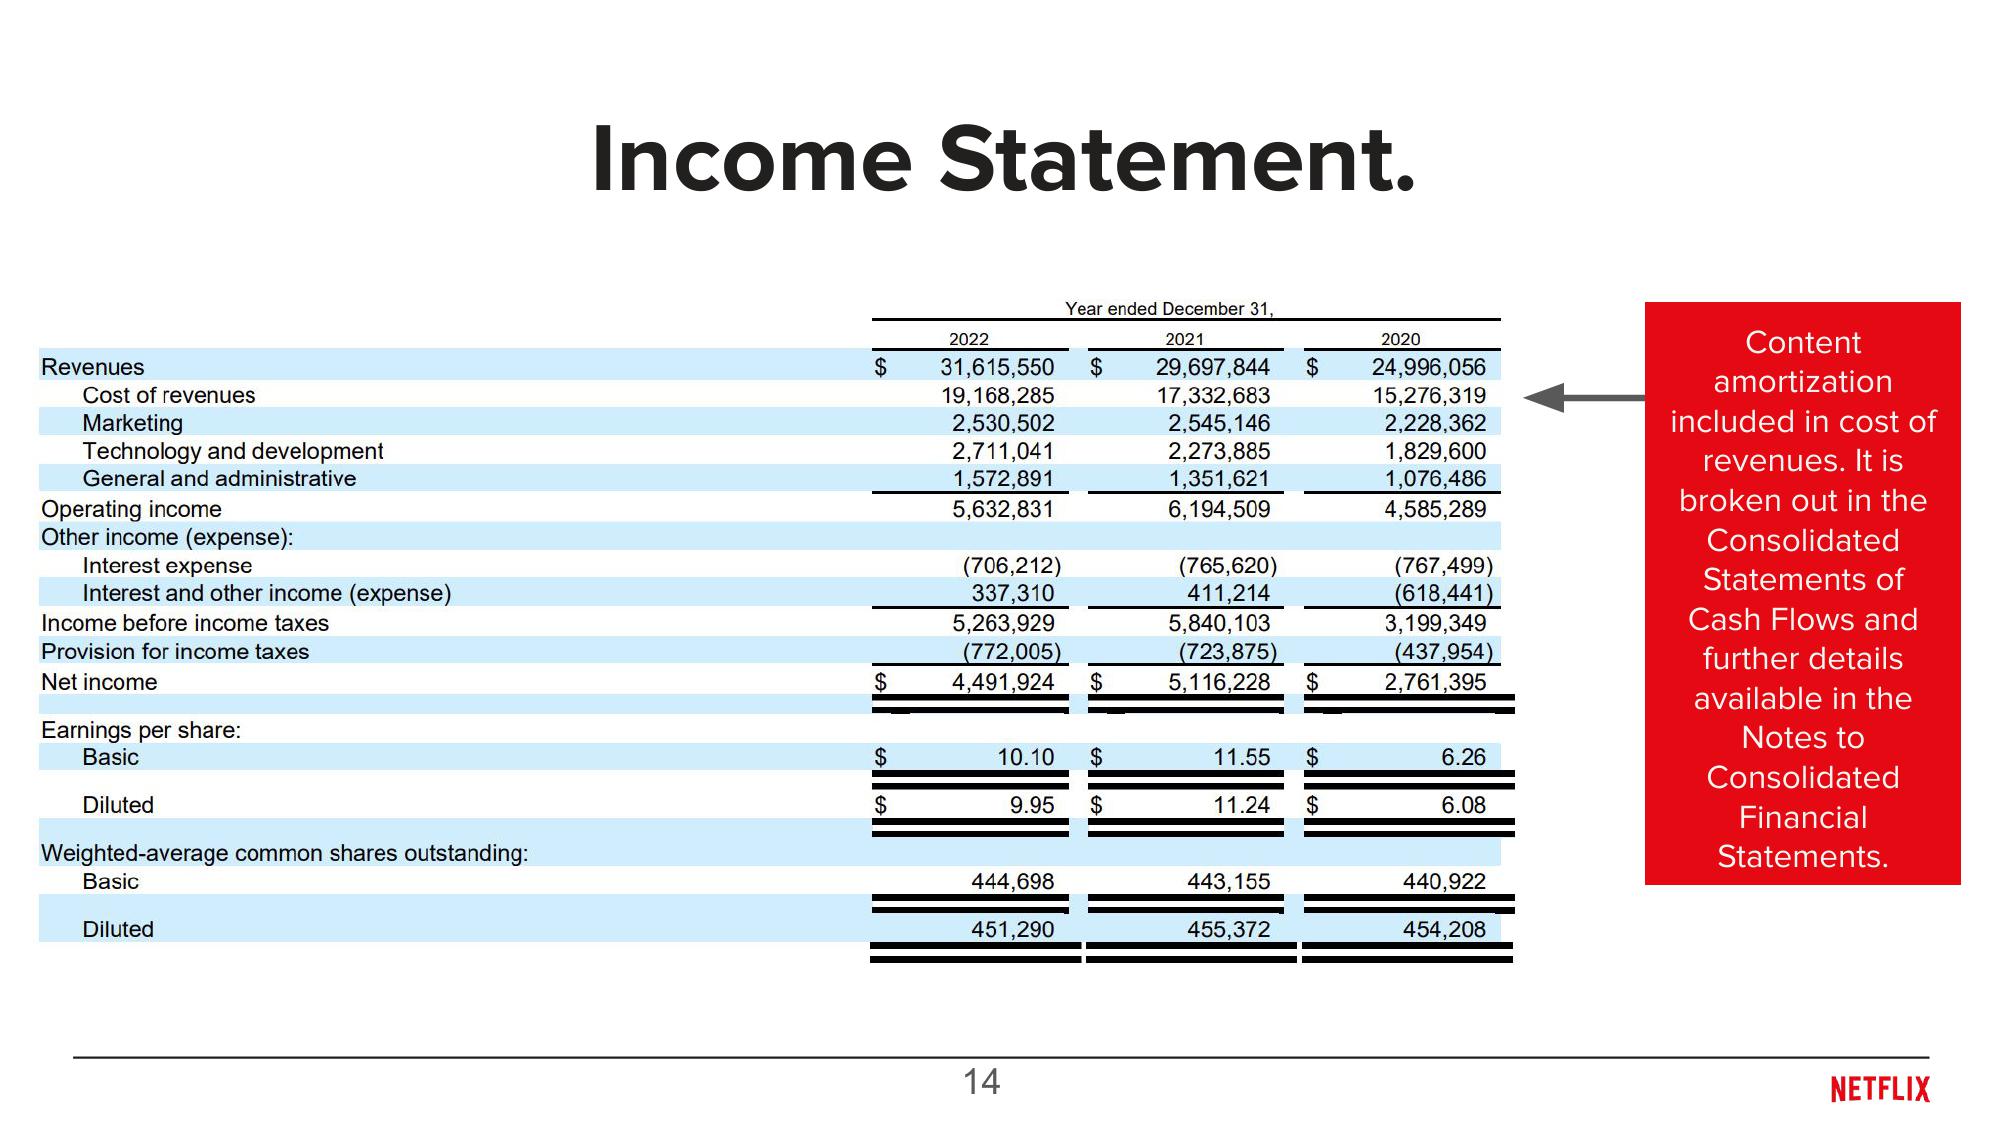
Income Statement.
$
$
$
$
2022
31,615,550 $
19,168,285
2,530,502
2,711,041
1,572,891
5,632,831
Year ended December 31,
2021
29,697,844
17,332,683
2,545,146
2,273,885
1,351,621
6,194,509
(706,212)
337,310
5,263,929
(772,005)
4,491,924 $
$
10.10
9.95 $
444,698
451,290
14
(765,620)
411,214
$
5,840,103
(723,875)
5,116,228 $
$
11.55
11.24 $
443,155
455,372
2020
24,996,056
15,276,319
2,228,362
1,829,600
1,076,486
4,585,289
(767,499)
(618,441)
3,199,349
(437,954)
2,761,395
6.26
6.08
440,922
454,208
Content
amortization
included in cost of
revenues. It is
broken out in the
Consolidated
Statements of
Cash Flows and
further details
available in the
Notes to
Consolidated
Financial
Statements.
NETFLIXView entire presentation