First Busey Results Presentation Deck
2Q23 Earnings Investor Presentation
5.5%
5.0%
4.5%
4.0%
3.5%
3.0%
2.5%
2.0%
Deposit Cost Trends
1
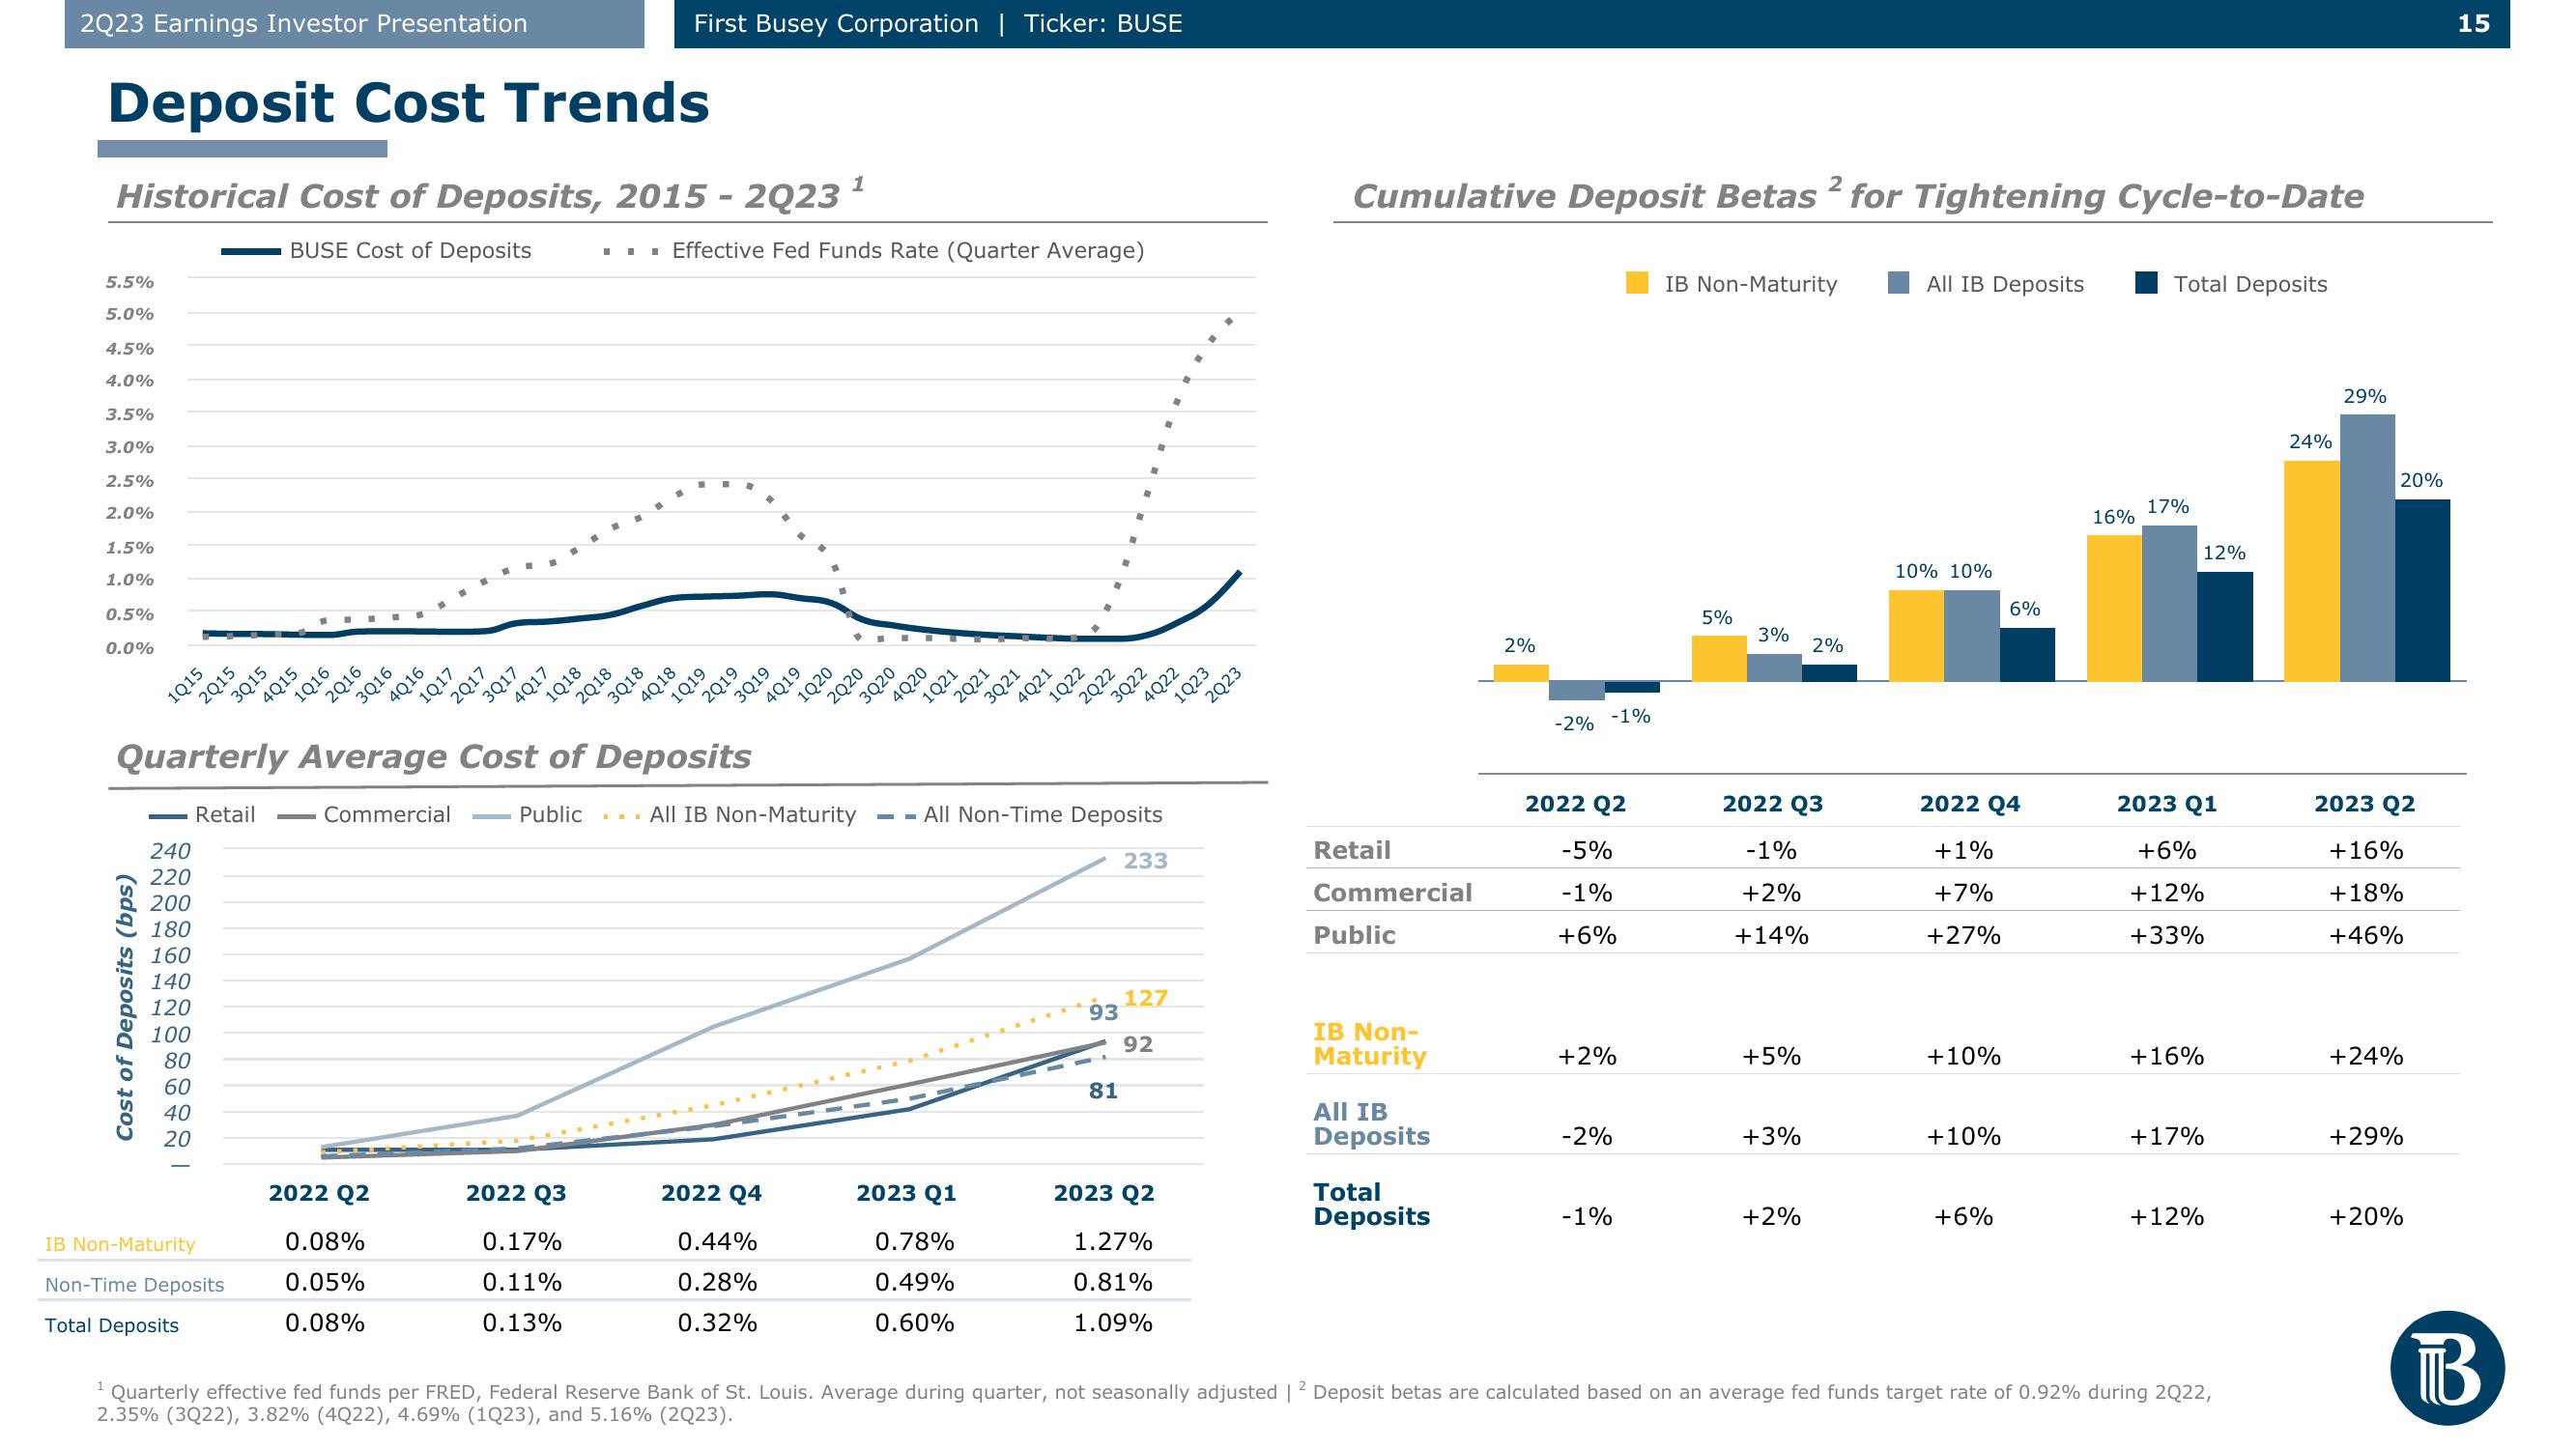
Historical Cost of Deposits, 2015 - 2023 ¹
BUSE Cost of Deposits
1.5%
1.0%
1
0.5%
0.0%
1Q15
Cost of Deposits (bps)
2015
240
220
200
180
160
140
120
100
80
60
40
20
IB Non-Maturity
Retail
Non-Time Deposits
Total Deposits
3Q15
4Q15
1Q16
2Q16
3Q16
4Q16
2022 Q2
1Q17
Commercial
0.08%
0.05%
0.08%
2Q17
3Q17
4Q17
Quarterly Average Cost of Deposits
1Q18
Public
2022 Q3
0.17%
0.11%
0.13%
▪ ▪ ▪ Effective Fed Funds Rate (Quarter Average)
2018
First Busey Corporation | Ticker: BUSE
3Q18
4018
1Q19
2019
3Q19
2022 Q4
0.44%
0.28%
0.32%
4Q19
1020
3020
2020
4Q20
1Q21
2Q21
2023 Q1
0.78%
0.49%
0.60%
3Q21
4Q21
1Q22
2022
93
"
"
All IB Non-Maturity --All Non-Time Deposits
81
M
3Q22
-
.
.
233
127
92
2023 Q2
1.27%
0.81%
1.09%
4Q22
1Q23
2Q23
Cumulative Deposit Betas 2 for Tightening Cycle-to-Date
Retail
Commercial
Public
IB Non-
Maturity
All IB
Deposits
Total
Deposits
2%
-2%
2022 Q2
-5%
-1%
+6%
-1%
+2%
-2%
-1%
IB Non-Maturity
5%
3%
2022 Q3
-1%
+2%
+14%
+5%
+3%
2%
+2%
All IB Deposits
10% 10%
2022 Q4
+1%
+7%
+27%
+10%
+10%
6%
+6%
16%
Total Deposits
17%
2023 Q1
+6%
+12%
+33%
+16%
+17%
12%
+12%
Quarterly effective fed funds per FRED, Federal Reserve Bank of St. Louis. Average during quarter, not seasonally adjusted | 2 Deposit betas are calculated based on an average fed funds target rate of 0.92% during 2Q22,
2.35% (3Q22), 3.82% (4Q22), 4.69% (1Q23), and 5.16% (2Q23).
24%
29%
2023 Q2
+16%
+18%
+46%
+24%
20%
+29%
+20%
15
ТВView entire presentation