LegalZoom.com Investor Presentation Deck slide image

LegalZoom.com Investor Presentation Deck

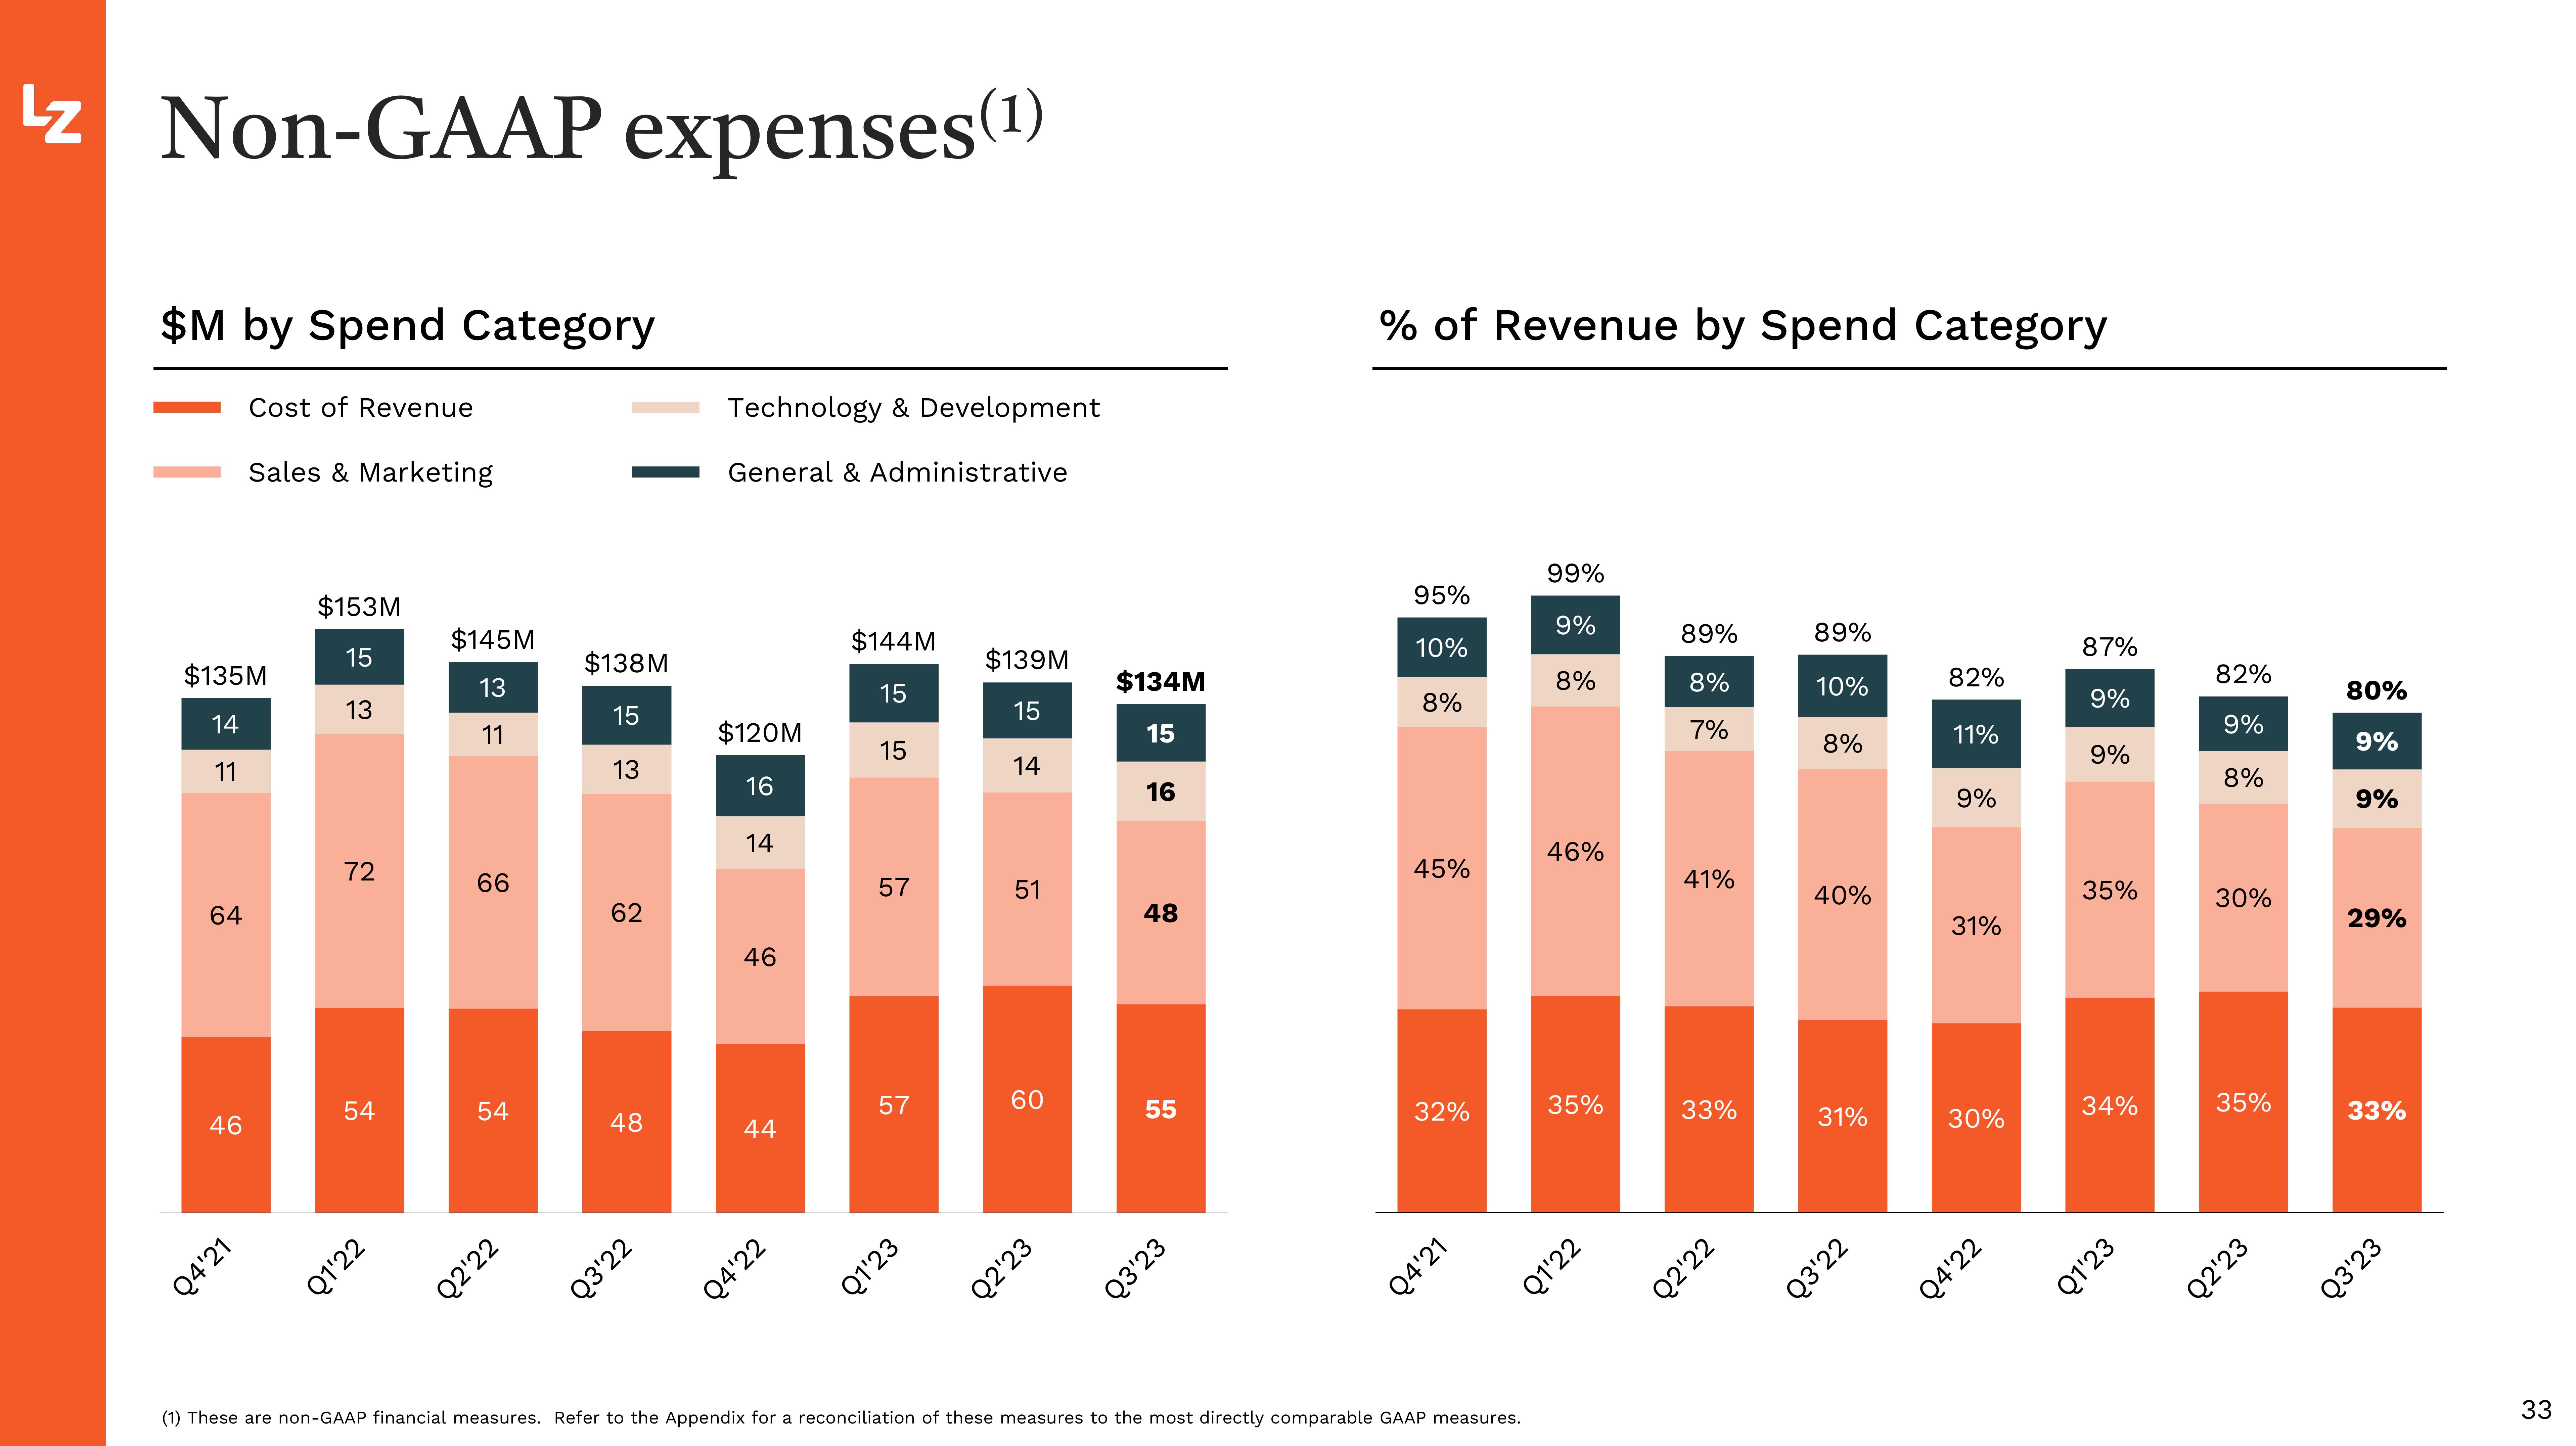
Lz Non-GAAP expenses(¹) $M by Spend Category 64 $135M 14 11 46 Cost of Revenue Q4'21 Sales & Marketing $153M 15 13 72 54 Q1'22 $145M 13 11 66 54 Q2'22 $138M 15 13 62 48 Q3'22 Technology & Development General & Administrative $120M 16 14 46 44 Q4'22 $144M 15 15 57 57 Q1'23 $139M 15 14 51 60 Q2'23 $134M 15 16 48 55 Q3'23 % of Revenue by Spend Category 95% 10% 8% 45% 32% Q4'21 99% 9% 8% (1) These are non-GAAP financial measures. Refer to the Appendix for a reconciliation of these measures to the most directly comparable GAAP measures. 46% 35% Q1'22 89% 8% 7% 41% 33% Q2'22 89% 10% 8% 40% 31% Q3'22 82% 11% 9% 31% 30% Q4'22 87% 9% 9% 35% 34% Q1'23 82% 9% 8% 30% 35% Q2'23 80% 9% 9% 29% 33% Q3'23 33
View entire presentation