Strategically Positioning Truist Insurance Holdings for Long-Term Success
Non-GAAP reconciliations
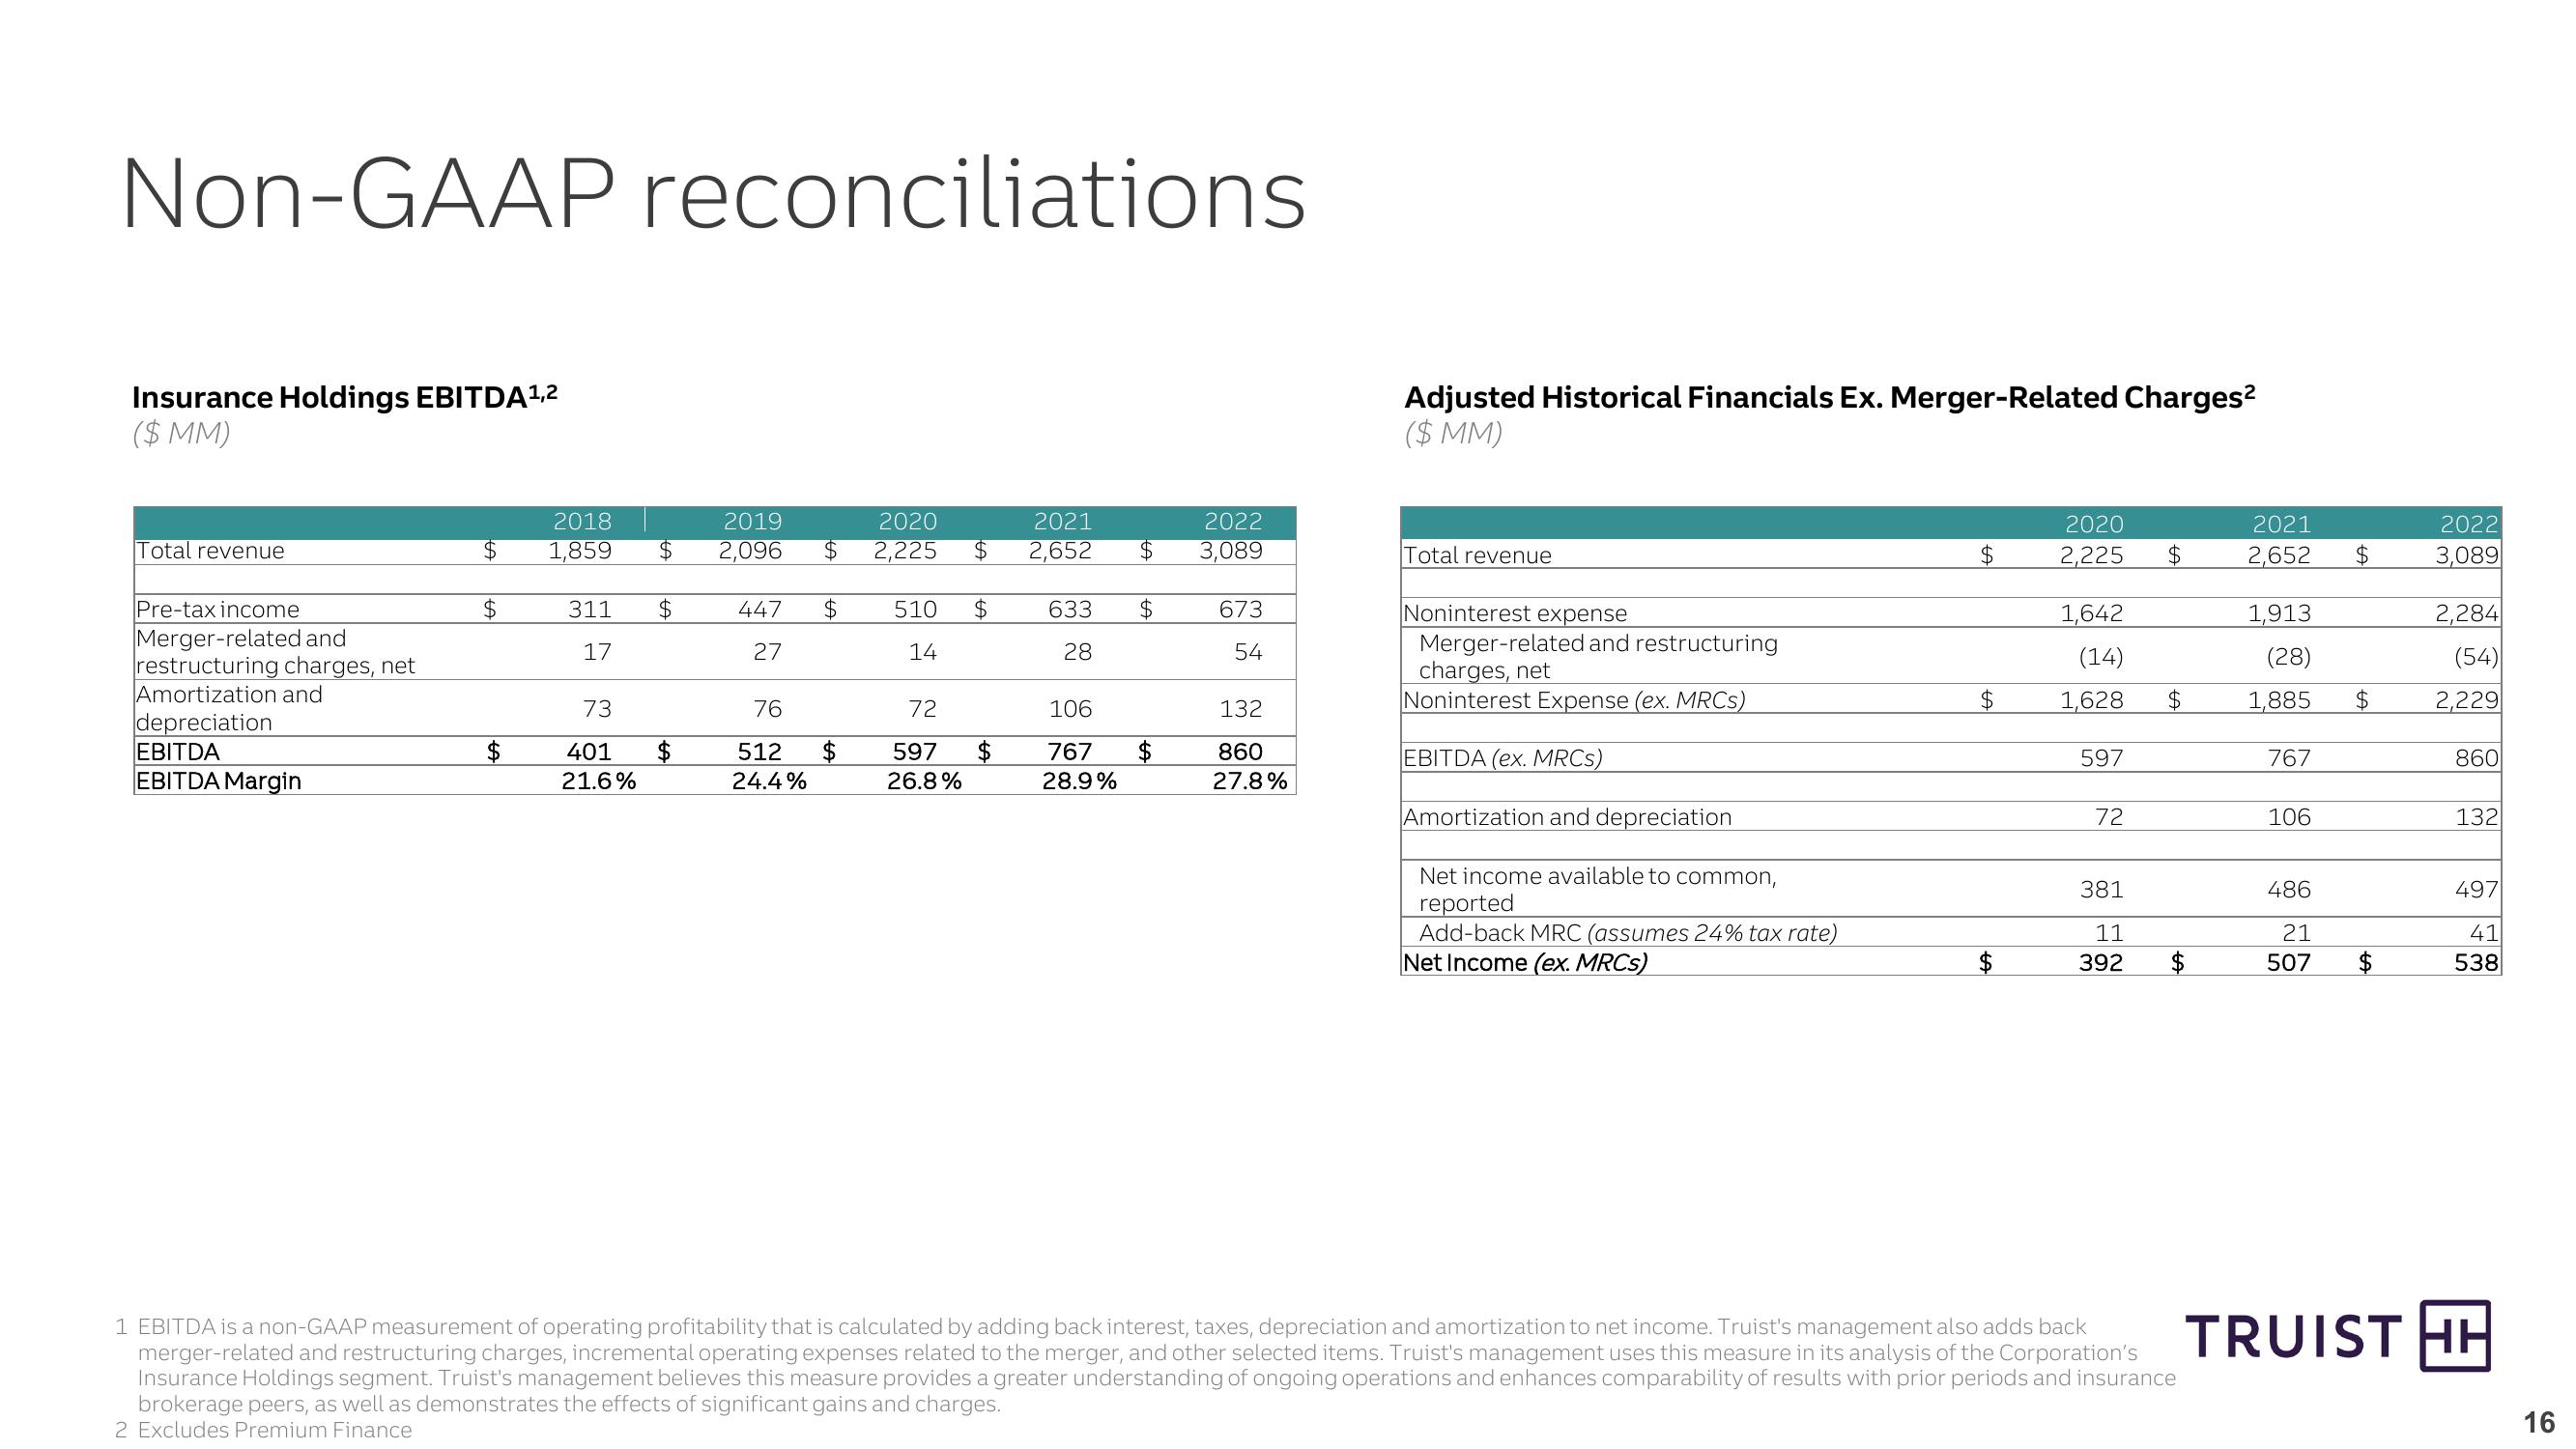
Insurance Holdings EBITDA 1,2
($ MM)
Adjusted Historical Financials Ex. Merger-Related Charges²
($ MM)
Total revenue
$
SA
2018
1,859
2019
2020
2021
2022
$
2,096 $
A
2,225 $ 2,652
$
3,089
Total revenue
$
2020
2,225 $
2021
2022
2,652 $
3,089
Pre-tax income
$
311
$
447
$
510 $
633
$
673
Noninterest expense
Merger-related and
17
27
14
28
54
restructuring charges, net
Merger-related and restructuring
charges, net
1,642
(14)
1,913
2,284
(28)
(54)
Amortization and
73
76
72
106
132
Noninterest Expense (ex. MRCs)
$
1,628
$
$
1,885
2,229
depreciation
EBITDA
EBITDA Margin
401
21.6%
$
512
24.4%
$
597
26.8%
$
767
28.9%
$
860
EBITDA (ex. MRCS)
597
767
860
27.8%
Amortization and depreciation
72
106
132
Net income available to common,
reported
Add-back MRC (assumes 24% tax rate)
Net Income (ex. MRCs)
381
486
497
11
+A
$
392
$
21
507
41
538
1 EBITDA is a non-GAAP measurement of operating profitability that is calculated by adding back interest, taxes, depreciation and amortization to net income. Truist's management also adds back
merger-related and restructuring charges, incremental operating expenses related to the merger, and other selected items. Truist's management uses this measure in its analysis of the Corporation's
Insurance Holdings segment. Truist's management believes this measure provides a greater understanding of ongoing operations and enhances comparability of results with prior periods and insurance
brokerage peers, as well as demonstrates the effects of significant gains and charges.
2 Excludes Premium Finance
TRUIST HH
16View entire presentation