Uber Results Presentation Deck
Revenue
$ in Millions
18.7%
Uber
$1,913
Q2 2020
(34%)
(38%)**
Q2 2021 Earnings
19.1%
$2,813
Q3 2020
(21%)
(20%)
18.5%
$3,165
Q4 2020
(16%)
(15%)
17.9%*
14.9%
$3,503*
$2,903
Q1 2021
(11%)
(11%)
17.9%
$3,929
Q2 2021
105%
95%
+12%
QoQ improvement
Revenue, Excluding
UK Accrual
% Growth YoY
% Constant Currency
Growth YoY
Take Rate
Take Rate Excluding
UK Accrual
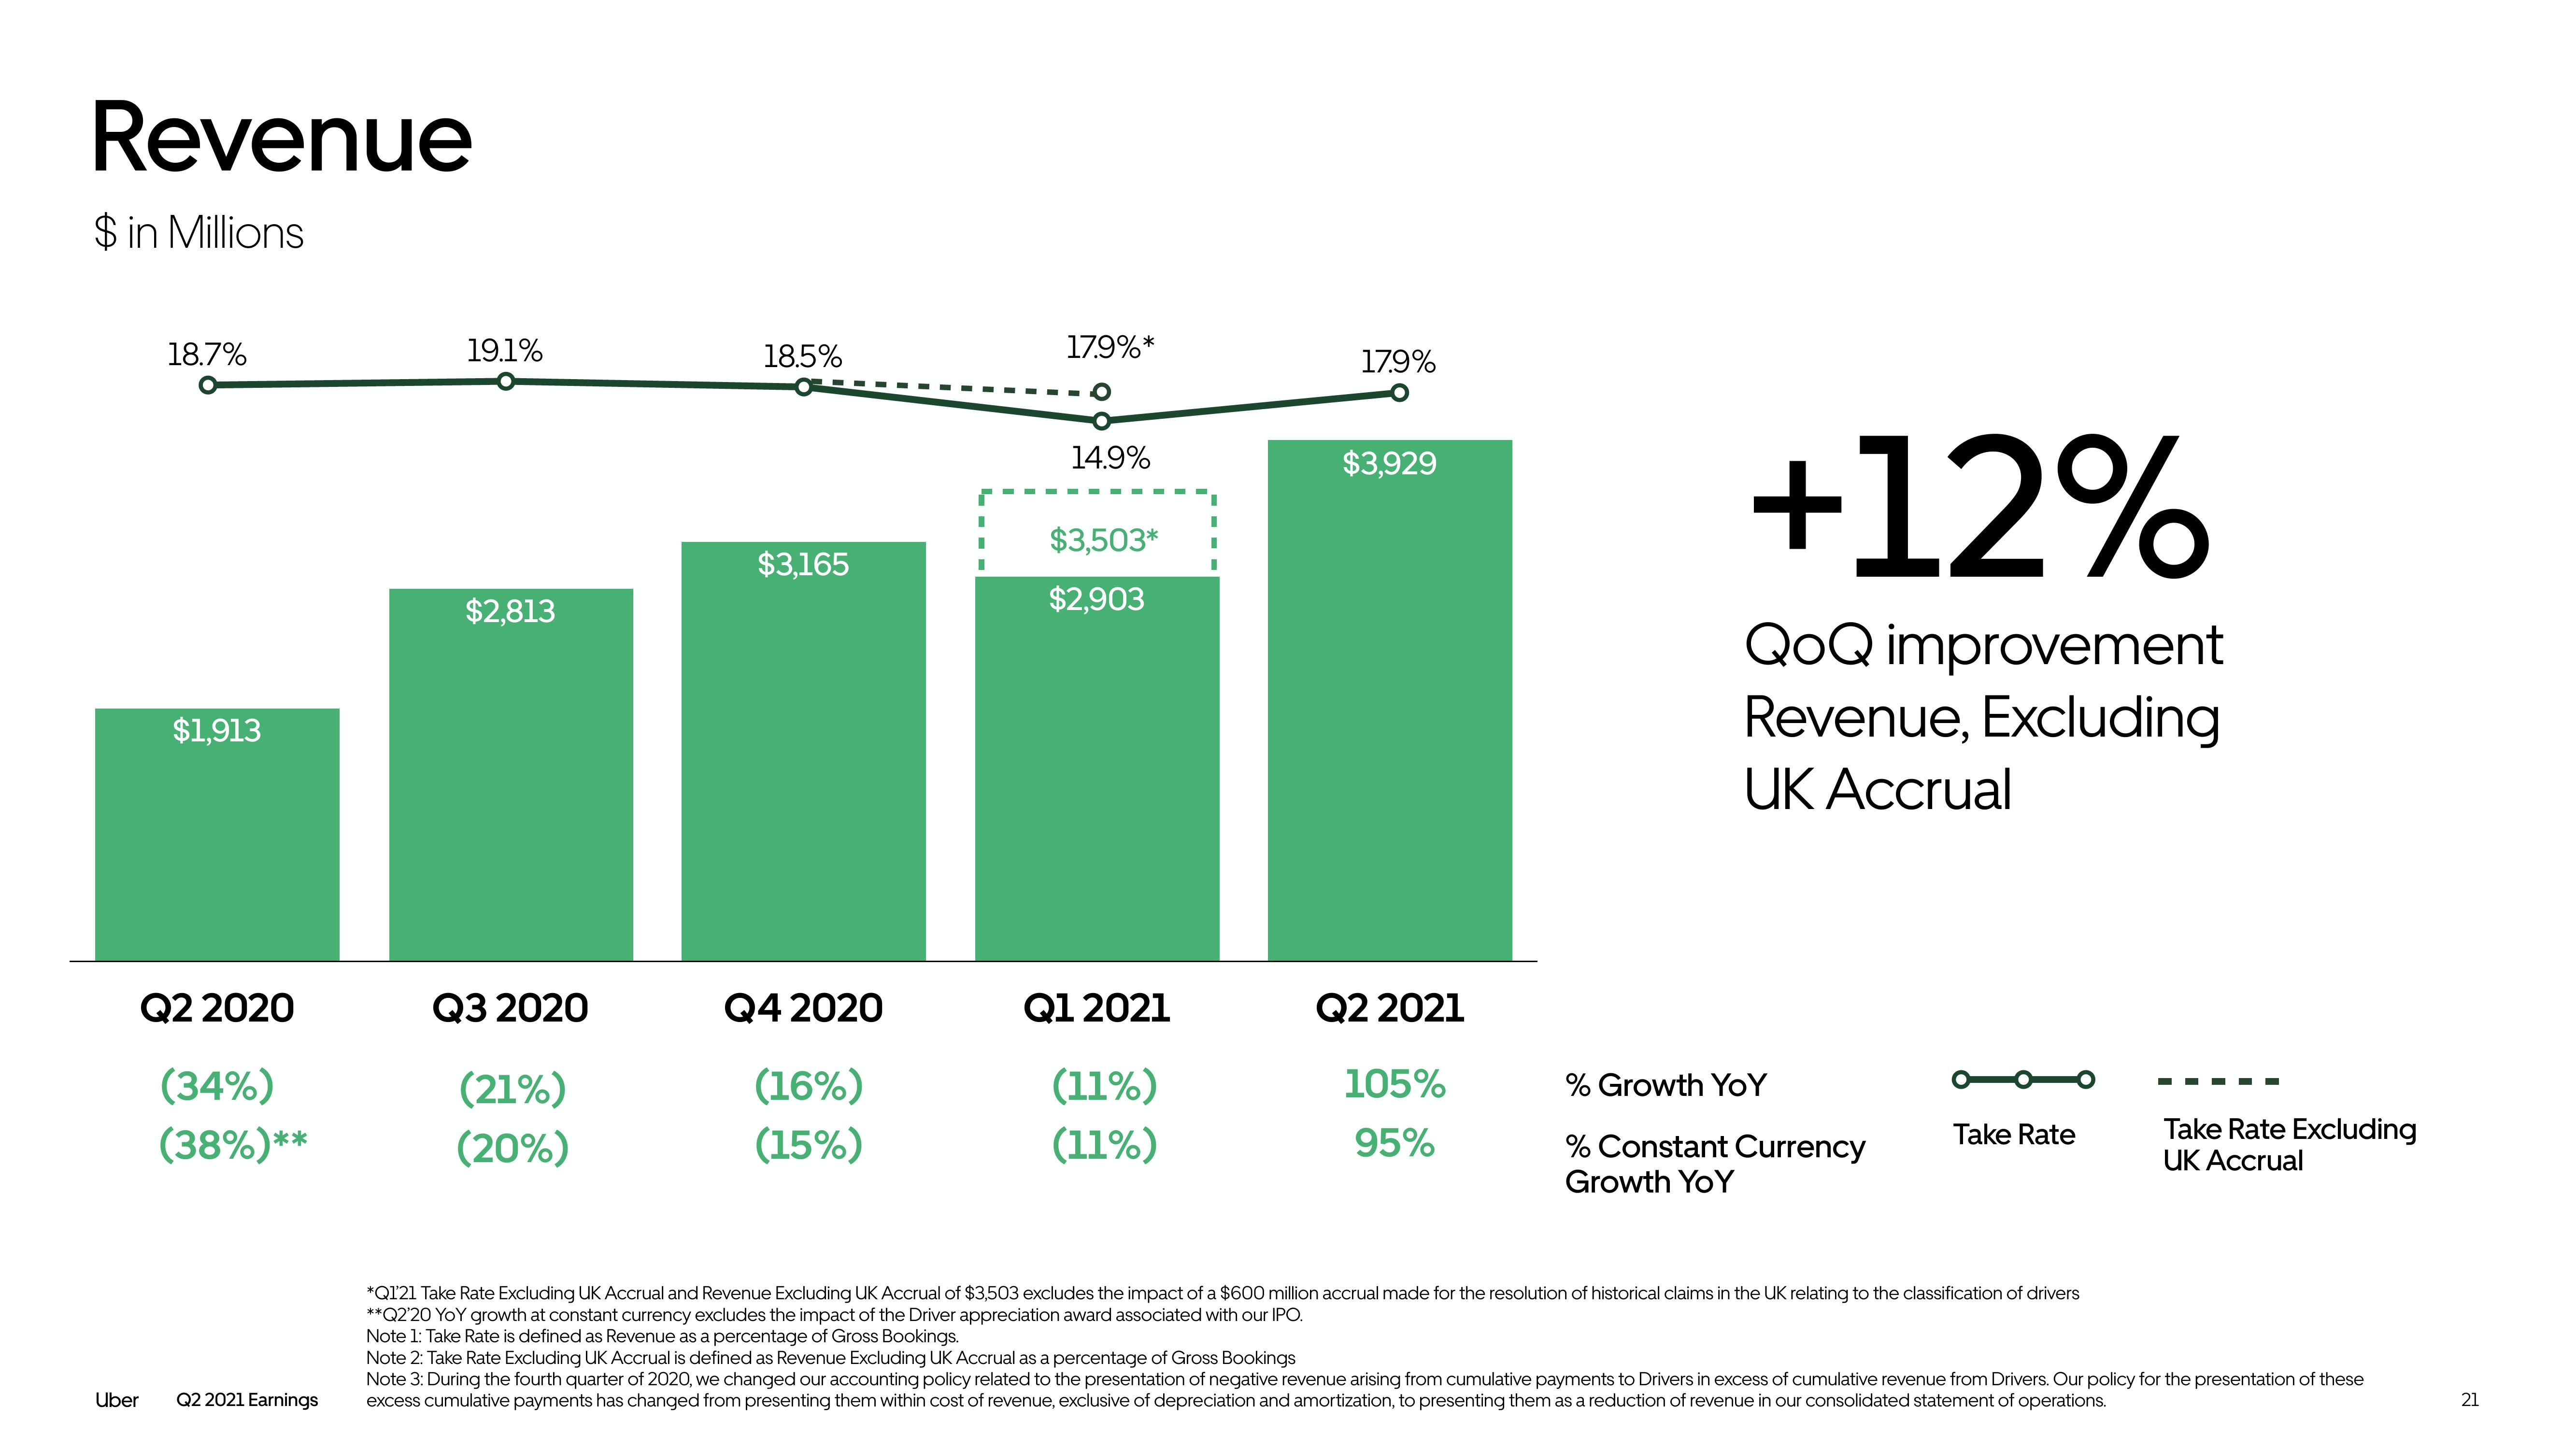
*Q1'21 Take Rate Excluding UK Accrual and Revenue Excluding UK Accrual of $3,503 excludes the impact of a $600 million accrual made for the resolution of historical claims in the UK relating to the classification of drivers
**Q2'20 YOY growth at constant currency excludes the impact of the Driver appreciation award associated with our IPO.
Note 1: Take Rate is defined as Revenue as a percentage of Gross Bookings.
Note 2: Take Rate Excluding UK Accrual is defined as Revenue Excluding UK Accrual as a percentage of Gross Bookings
Note 3: During the fourth quarter of 2020, we changed our accounting policy related to the presentation of negative revenue arising from cumulative payments to Drivers in excess of cumulative revenue from Drivers. Our policy for the presentation of these
excess cumulative payments has changed from presenting them within cost of revenue, exclusive of depreciation and amortization, to presenting them as a reduction of revenue in our consolidated statement of operations.
21View entire presentation