Evercore Investment Banking Pitch Book
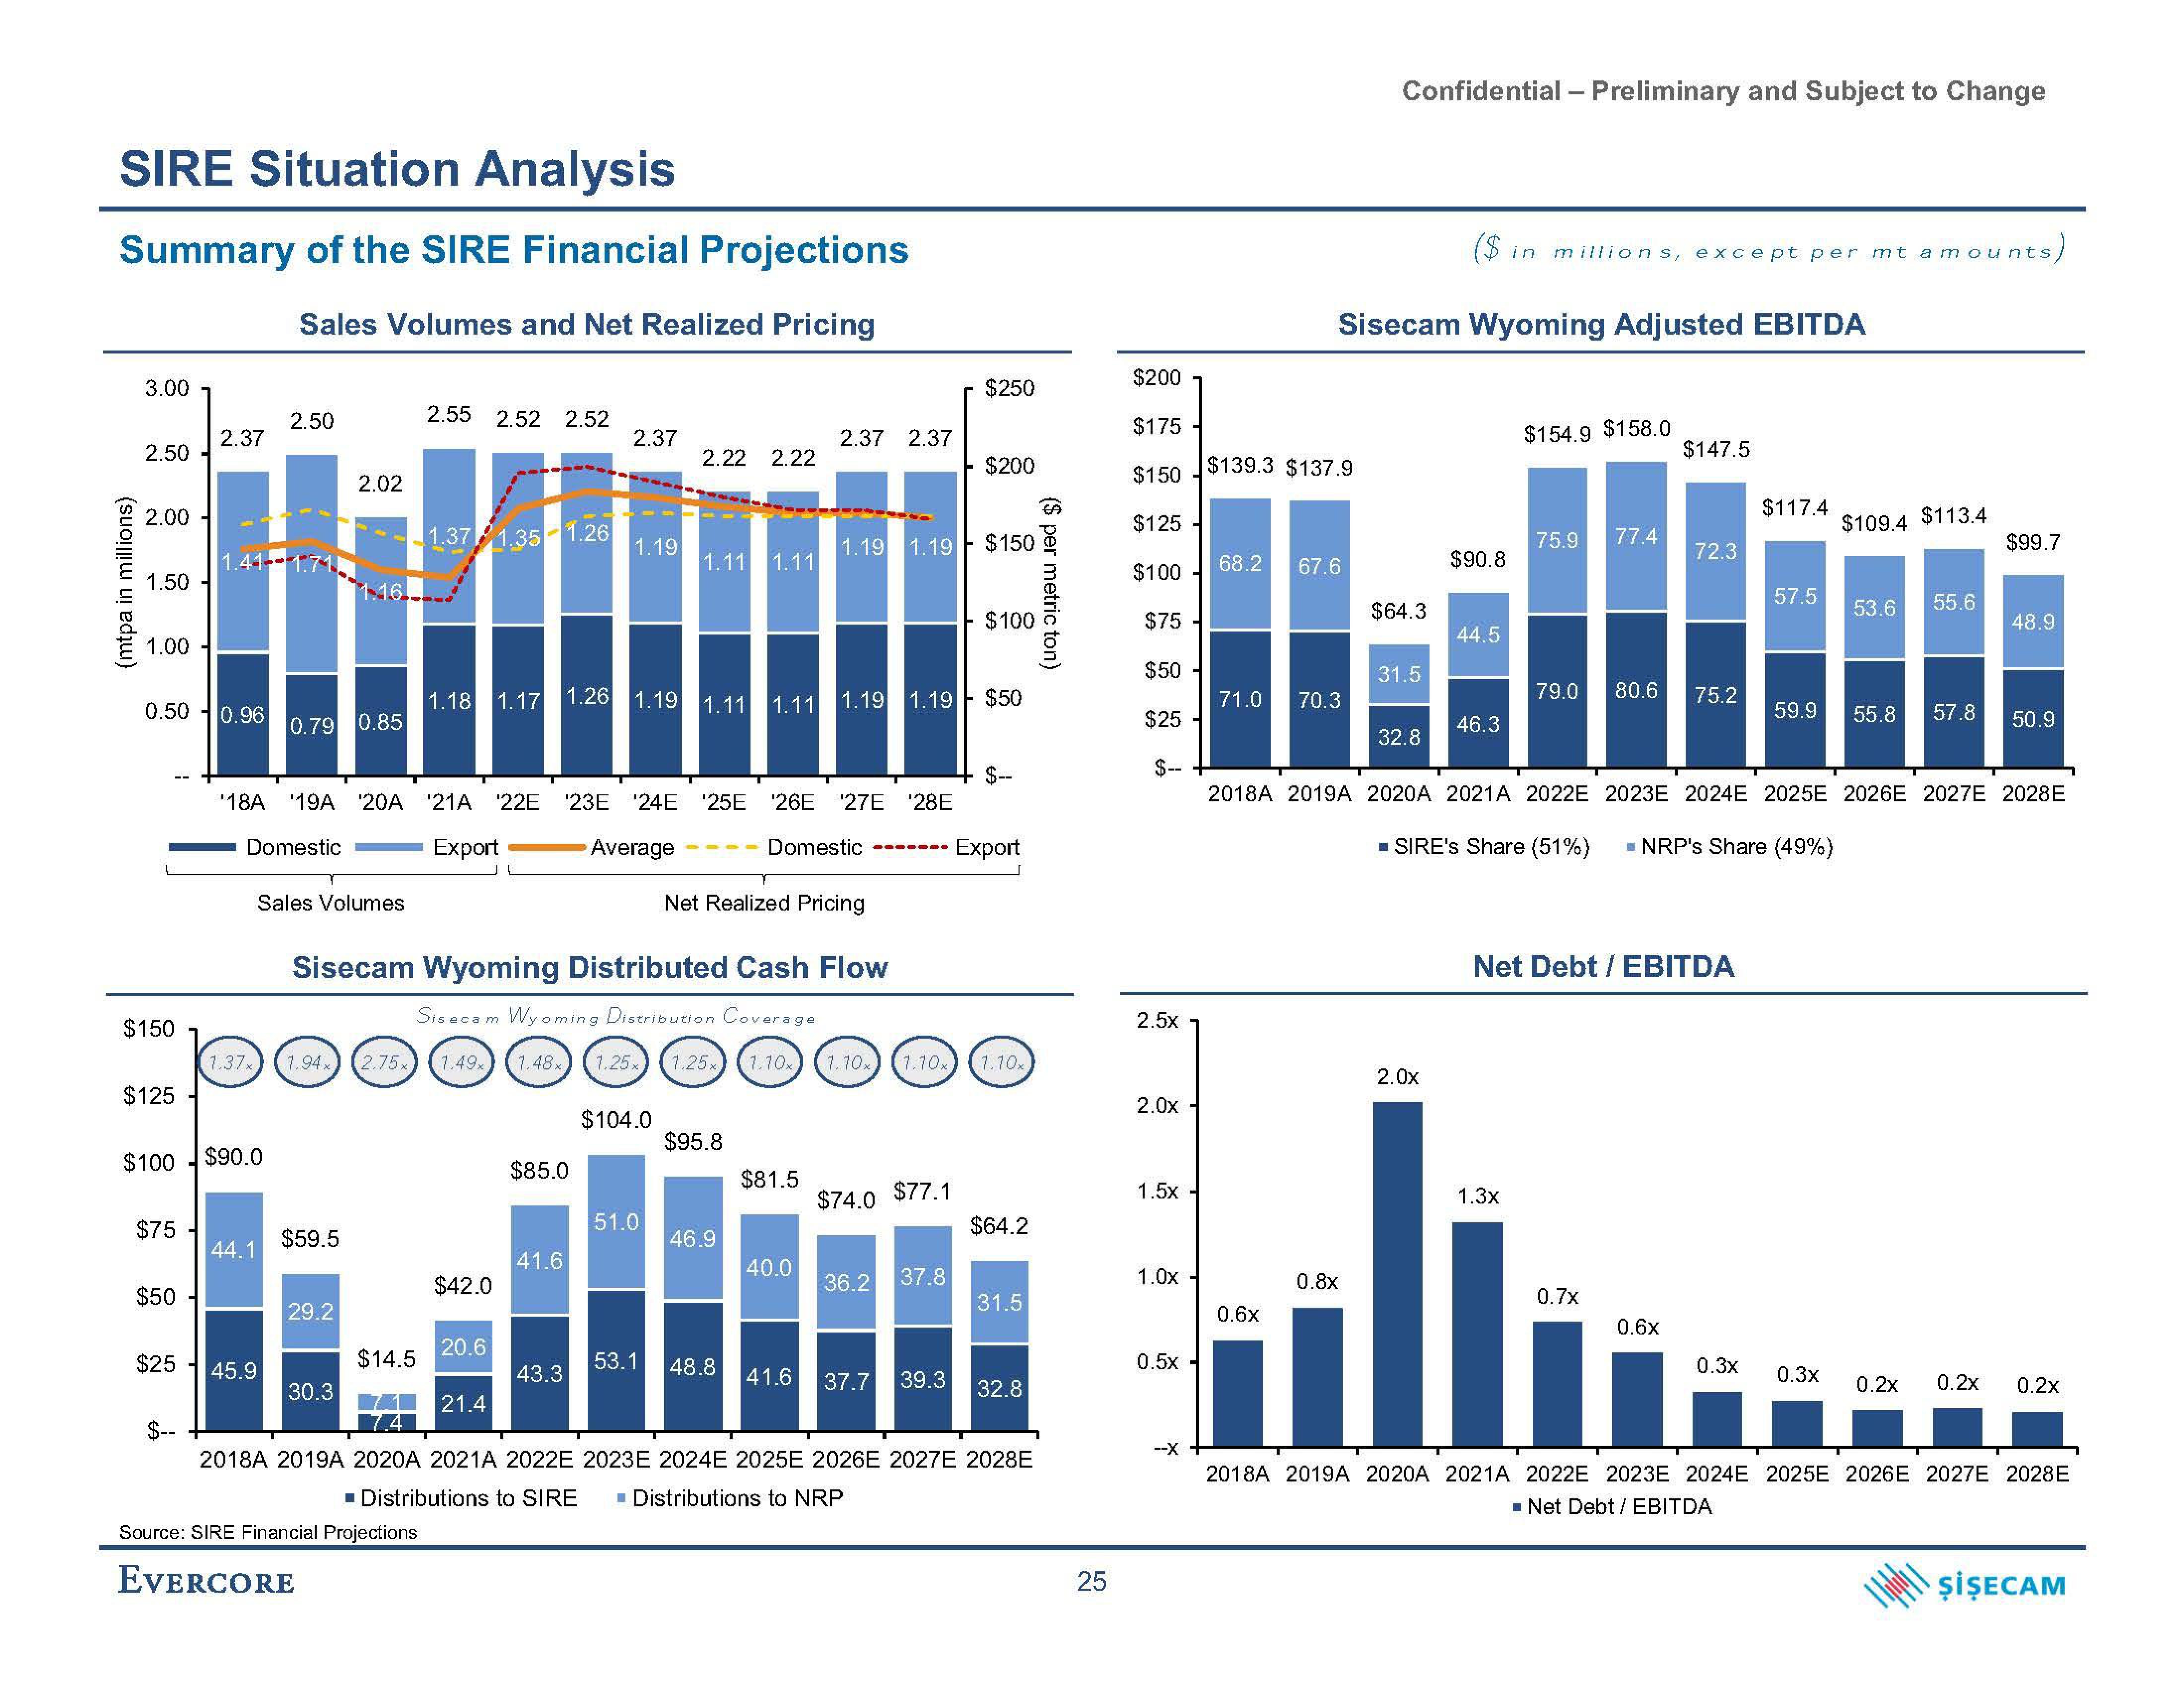
SIRE Situation Analysis
Summary of the SIRE Financial Projections
Sales Volumes and Net Realized Pricing
(mtpa in millions)
3.00
2.50
2.00
1.50
1.00
$150
0.50 0.96
$125
$75 -
2.37
$50-
1.41
$--
$100 $90.0
2.50
44.1
$25 45.9
0.79 0.85
Sales Volumes
2.02
$59.5
1.16.
29.2
2.55 2.52 2.52
30.3
1.37 1.35-1.26
1.18
$14.5
1.37x) 1.94x 2.75x) 1.49x (1.48x 1.25, (1.25x
$42.0
Net Realized Pricing
Sisecam Wyoming Distributed Cash Flow
Sisecam Wyoming Distribution Coverage
20.6
18A '19A '20A ¹21A 22E '23E '24E '25E ¹26E '27E ¹28E
Domestic
Export
Domestic▪▪▪▪▪ Export
7.1 21.4
2.37
1.19
$85.0
41.6
1.17 1.26 1.19 1.11 1.11 1.19 1.19
43.3
Average
2.22 2.22
1.11 1.11
$104.0
51.0
$95.8
46.9
53.1 48.8
2.37 2.37
1.10x
1.19 1.19
$81.5
40.0
1.10x 1.10x
$74.0
$77.1
36.2 37.8
$250
41.6 37.7 39.3
$200
$150
$100
$50
$--
1.10x
$64.2
31.5
32.8
2018A 2019A 2020A 2021A 2022E 2023E 2024E 2025E 2026E 2027E 2028E
■ Distributions to SIRE ■ Distributions to NRP
Source: SIRE Financial Projections
EVERCORE
($ per metric ton)
25
$200
$175
$150
$125-
$100 68.2
$75 -
$50
$25
$--
2.5x
2.0x
1.5x
1.0x-
0.5x
--X
$139.3 $137.9
Sisecam Wyoming Adjusted EBITDA
67.6
71.0 70.3
0.6x
Confidential - Preliminary and Subject to Change
0.8x
$64.3
31.5
32.8
($ in millions, except per mt amounts,
$90.8
2.0x
44.5
46.3
$154.9 $158.0
75.9
79.0
■ SIRE's Share (51%)
1.3x
77.4
80.6
0.7x
$147.5
72.3
75.2
Net Debt / EBITDA
0.6x
$117.4
2018A 2019A 2020A 2021A 2022E 2023E 2024E 2025E 2026E 2027E 2028E
57.5
■ NRP's Share (49%)
0.3x
59.9
$109.4 $113.4
0.3x
53.6 55.6
55.8 57.8
$99.7
0.2x
48.9
50.9
0.2x 0.2x
2018A 2019A 2020A 2021A 2022E 2023E 2024E 2025E 2026E 2027E 2028E
■ Net Debt / EBITDA
ŞİŞECAMView entire presentation