First Busey Results Presentation Deck
1.
2.
4Q23 Earnings Investor Presentation
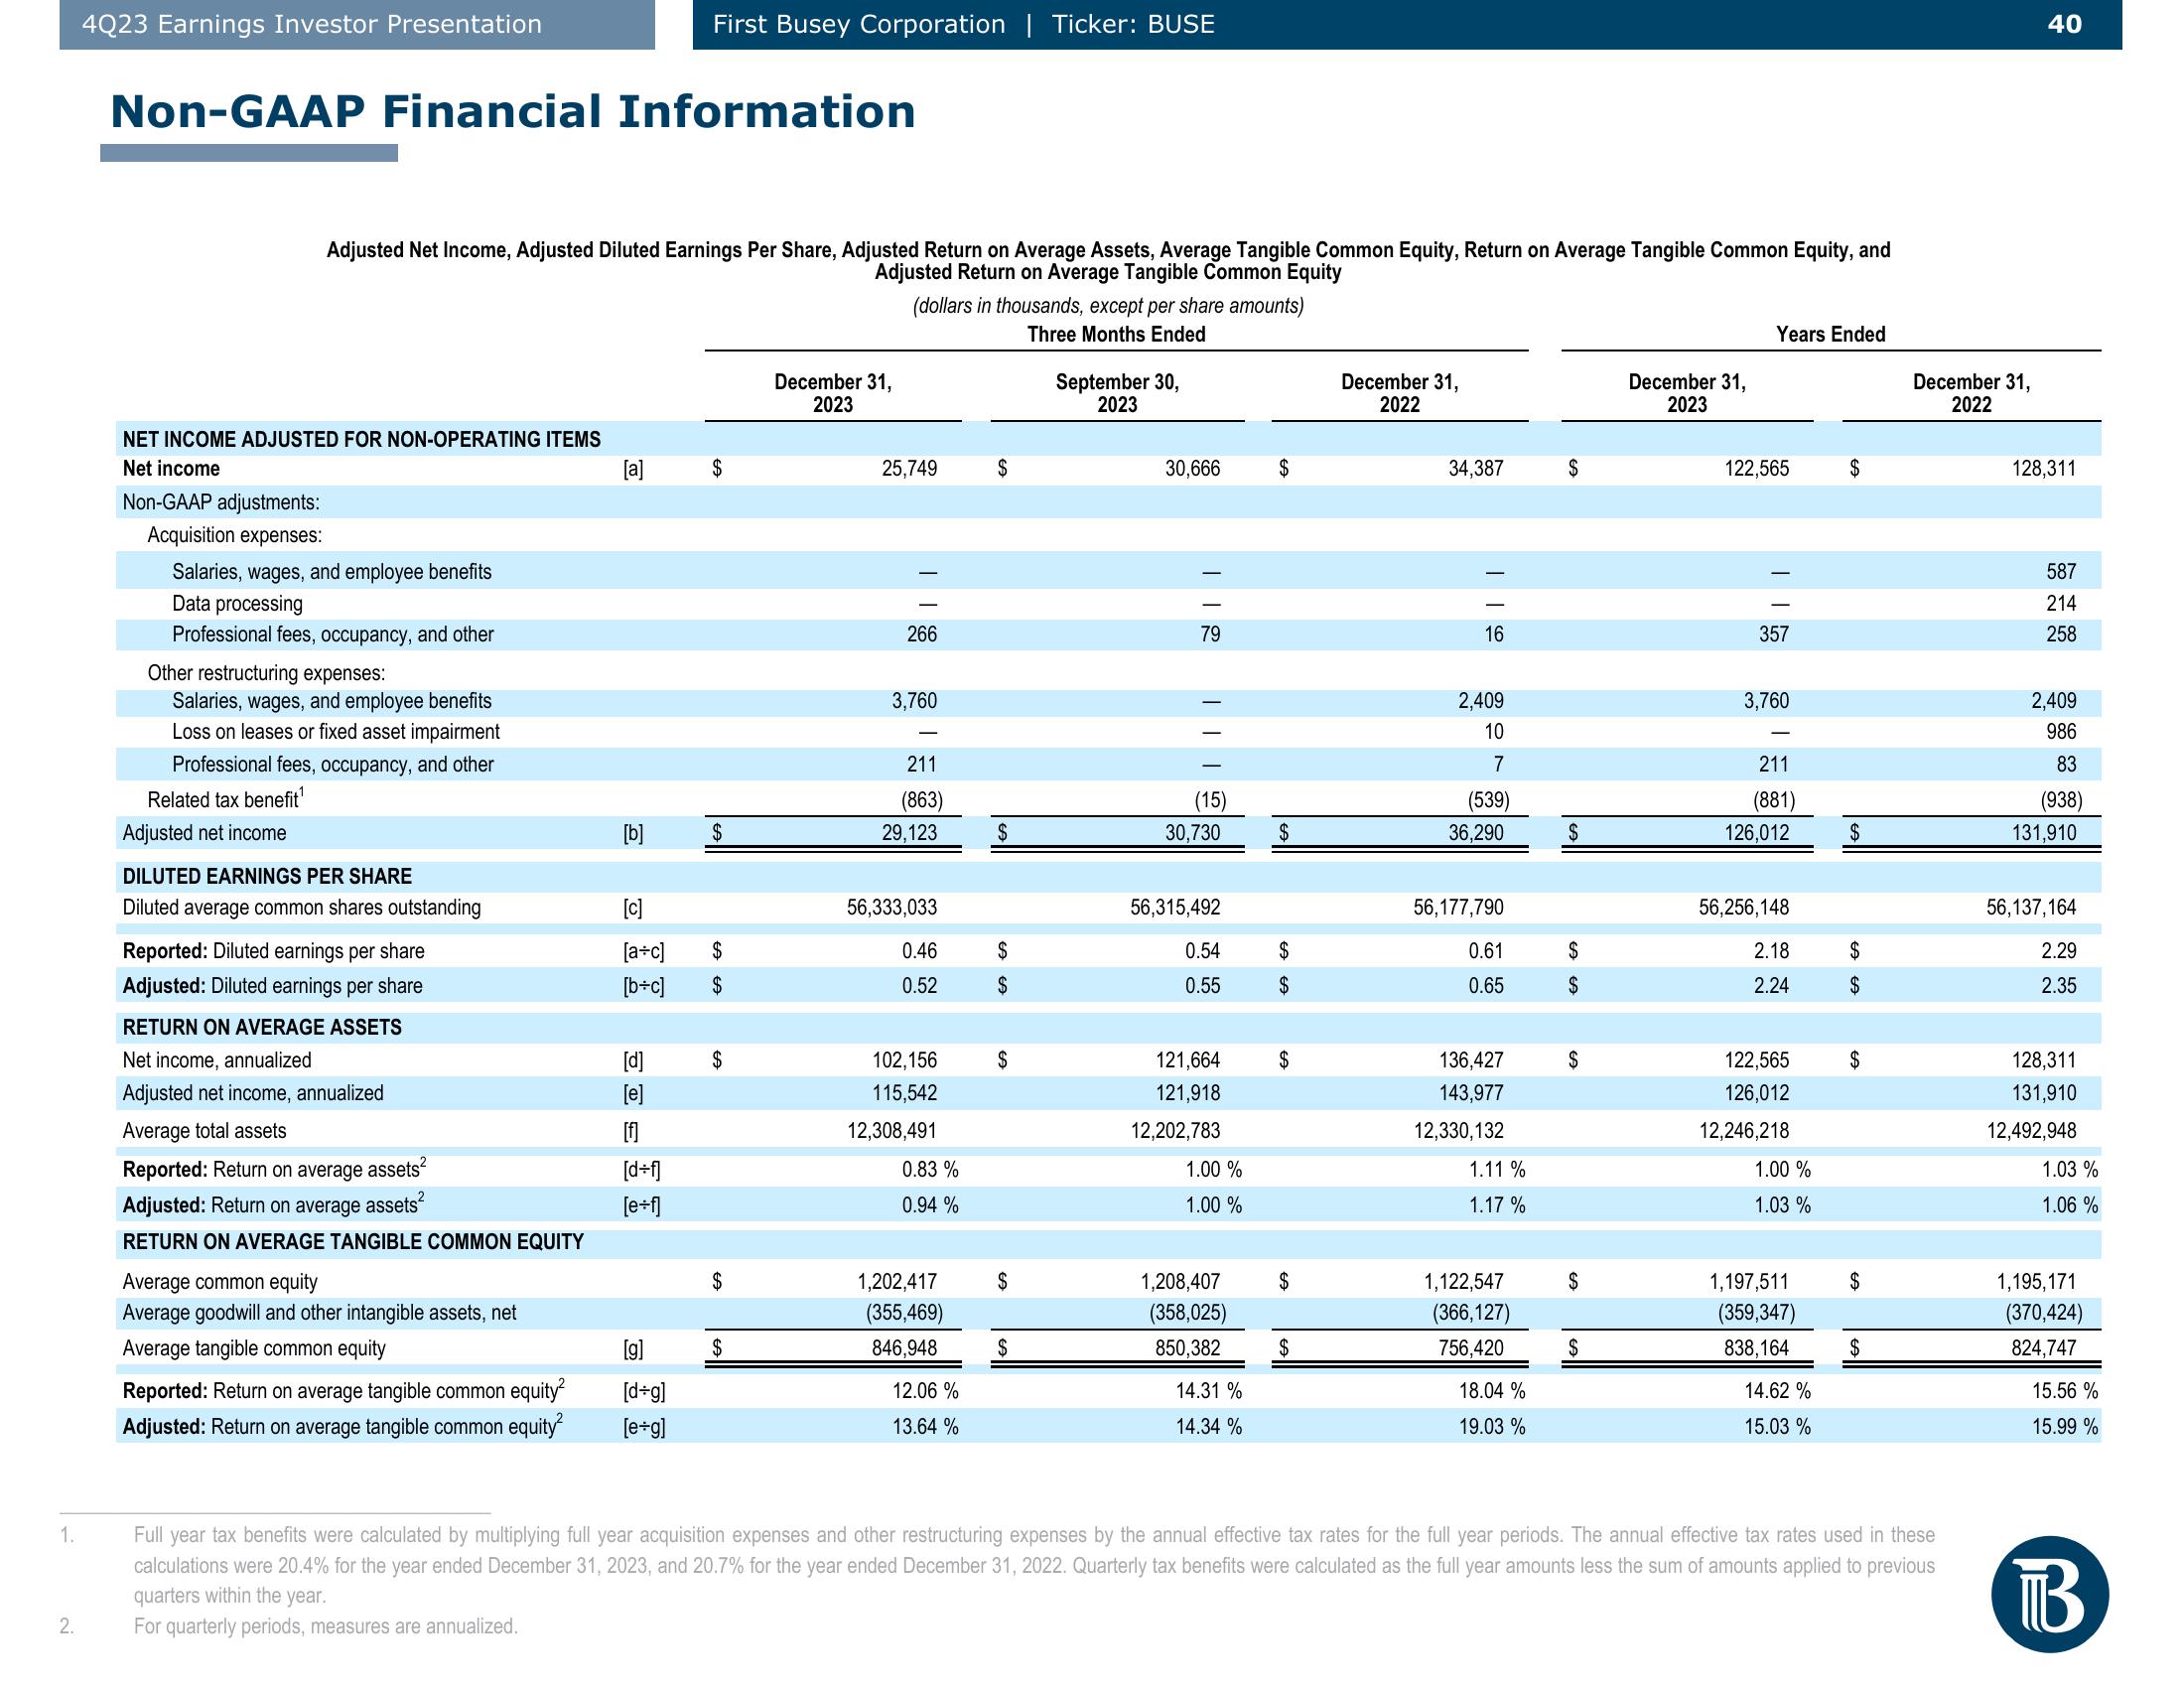
Non-GAAP Financial Information
Adjusted Net Income, Adjusted Diluted Earnings Per Share, Adjusted Return on Average Assets, Average Tangible Common Equity, Return on Average Tangible Common Equity, and
Adjusted Return on Average Tangible Common Equity
NET INCOME ADJUSTED FOR NON-OPERATING ITEMS
Net income
Non-GAAP adjustments:
Acquisition expenses:
Salaries, wages, and employee benefits
Data processing
Professional fees, occupancy, and other
Other restructuring expenses:
Salaries, wages, and employee benefits
Loss on leases or fixed asset impairment
Professional fees, occupancy, and other
Related tax benefit¹
Adjusted net income
DILUTED EARNINGS PER SHARE
Diluted average common shares outstanding
Reported: Diluted earnings per share
Adjusted: Diluted earnings per share
RETURN ON AVERAGE ASSETS
Net income, annualized
Adjusted net income, annualized
Average total assets
Reported: Return on average assets²
Adjusted: Return on average assets
RETURN ON AVERAGE TANGIBLE COMMON EQUITY
Average common equity
Average goodwill and other intangible assets, net
Average tangible common equity
Reported: Return on average tangible common equity²
Adjusted: Return on average tangible common equity²
[a]
[b]
[c]
[a+c]
[b+c]
First Busey Corporation | Ticker: BUSE
[d]
[e]
[f]
[d+f]
[e+f]
[g]
[d+g]
[e+g]
$
$
GA GA
$
$
$
$
$
December 31,
2023
(dollars in thousands, except per share amounts)
Three Months Ended
25,749
266
3,760
211
(863)
29,123
56,333,033
0.46
0.52
102,156
115,542
12,308,491
0.83%
0.94%
1,202,417
(355,469)
846,948
12.06%
13.64%
$
$
$
$
$
$
$
September 30,
2023
30,666
79
(15)
30,730
56,315,492
0.54
0.55
121,664
121,918
12,202,783
1.00 %
1.00%
1,208,407
(358,025)
850,382
14.31%
14.34 %
$
$
LA GA
$
$
$
$
December 31,
2022
34,387
||
16
2,409
10
7
(539)
36,290
56,177,790
0.61
0.65
136,427
143,977
12,330,132
1.11%
1.17%
1,122,547
(366,127)
756,420
18.04%
19.03 %
$
$
$
$
$
$
$
December 31,
2023
Years Ended
122,565
357
3,760
211
(881)
126,012
56,256,148
2.18
2.24
122,565
126,012
12,246,218
1.00%
1.03 %
1,197,511
(359,347)
838,164
14.62 %
15.03 %
$
$
LA L
$
$
$
$
$
December 31,
2022
40
128,311
587
214
258
2,409
986
83
(938)
131,910
56,137,164
2.29
2.35
128,311
131,910
12,492,948
1.03 %
1.06 %
1,195,171
(370,424)
824,747
15.56 %
15.99 %
Full year tax benefits were calculated by multiplying full year acquisition expenses and other restructuring expenses by the annual effective tax rates for the full year periods. The annual effective tax rates used in these
calculations were 20.4% for the year ended December 31, 2023, and 20.7% for the year ended December 31, 2022. Quarterly tax benefits were calculated as the full year amounts less the sum of amounts applied to previous
quarters within the year.
B
For quarterly periods, measures are annualized.View entire presentation