Snowflake Results Presentation Deck
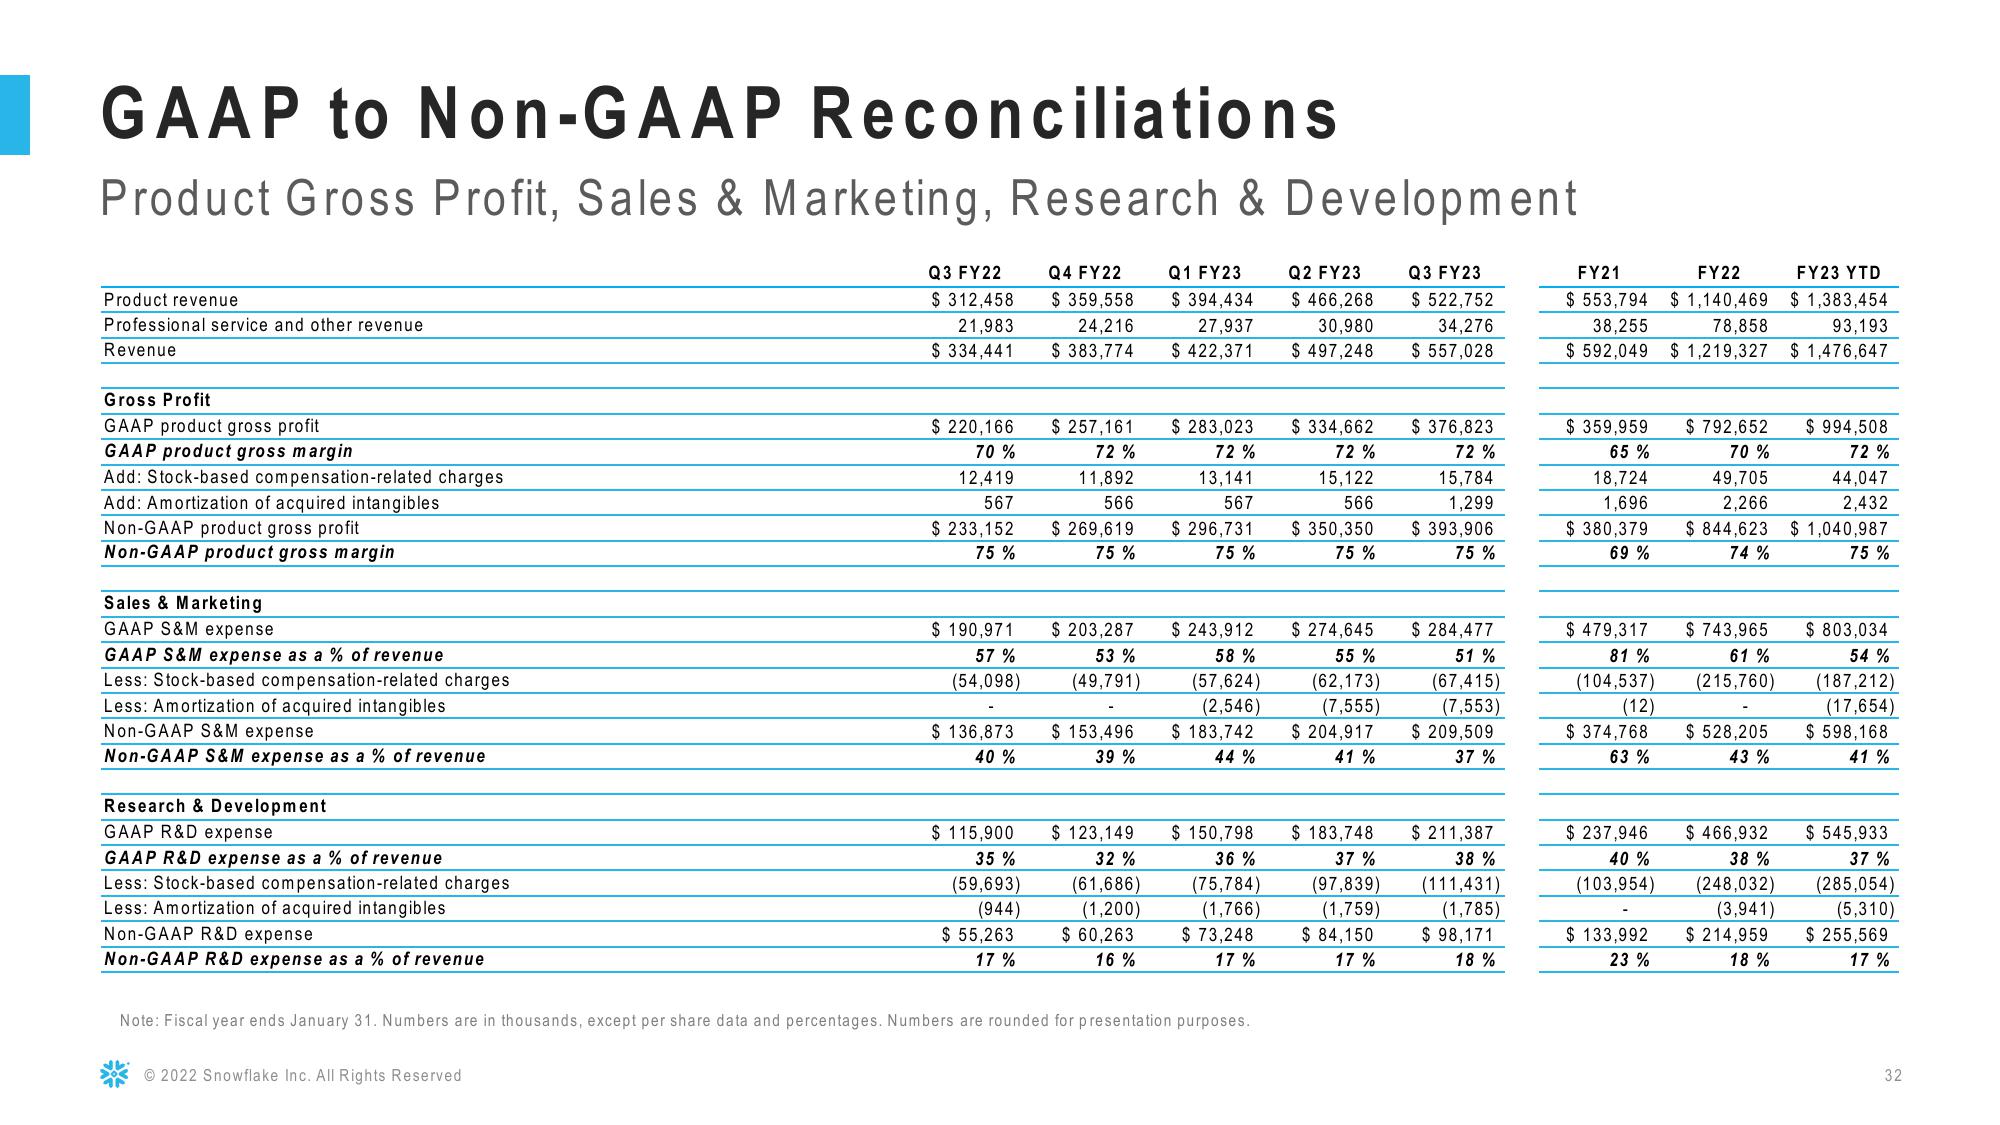
GAAP to Non-GAAP Reconciliations
Product Gross Profit, Sales & Marketing, Research & Development
Product revenue
Professional service and other revenue
Revenue
Gross Profit
GAAP product gross profit
GAAP product gross margin
Add: Stock-based compensation-related charges
Add: Amortization of acquired intangibles
Non-GAAP product gross profit
Non-GAAP product gross margin
Sales & Marketing
GAAP S&M expense
GAAP S&M expense as a % of revenue
Less: Stock-based compensation-related charges
Less: Amortization of acquired intangibles
Non-GAAP S&M expense
Non-GAAP S&M expense as a % of revenue
Research & Development
GAAP R&D expense
GAAP R&D expense as a % of revenue
Less: Stock-based compensation-related charges
Less: Amortization of acquired intangibles
Non-GAAP R&D expense
Non-GAAP R&D expense as a % of revenue
Q3 FY22
$ 312,458
21,983
$ 334,441
Ⓒ2022 Snowflake Inc. All Rights Reserved
$ 220,166
70%
12,419
567
$ 233,152
75%
$ 190,971
57 %
(54,098)
$ 136,873
40 %
$ 115,900
35%
(59,693)
(944)
$ 55,263
17%
Q4 FY22
$ 359,558
24,216
$ 383,774
$ 257,161
72%
11,892
566
$ 269,619
75%
$ 203,287
53%
(49,791)
$ 153,496
39%
$ 123,149
32%
(61,686)
(1,200)
$ 60,263
16%
Q1 FY23
$ 394,434
27,937
$ 422,371
$ 283,023
72%
13,141
567
$ 296,731
75 %
$ 243,912
58%
(57,624)
(2,546)
$ 183,742
44%
$ 150,798
36%
(75,784)
(1,766)
$ 73,248
17%
Note: Fiscal year ends January 31. Numbers are in thousands, except per share data and percentages. Numbers are rounded for presentation purposes.
Q2 FY23
$ 466,268
30,980
$ 497,248
$ 334,662
72%
15,122
566
$ 350,350
75%
$ 274,645
55%
(62,173)
(7,555)
$ 204,917
41%
$ 183,748
37%
(97,839)
(1,759)
$ 84,150
17%
Q3 FY23
$ 522,752
34,276
$ 557,028
$ 376,823
72 %
15,784
1,299
$ 393,906
75%
$ 284,477
51%
(67,415)
(7,553)
$ 209,509
37%
$ 211,387
38 %
(111,431)
(1,785)
$ 98,171
18%
FY21
FY22
$ 553,794 $1,140,469
38,255
78,858
$592,049 $ 1,219,327
$ 359,959
65%
18,724
1,696
$380,379
69%
$479,317
81%
(104,537)
(12)
$374,768
63%
$ 237,946
40 %
(103,954)
$ 133,992
23 %
$ 792,652
70%
49,705
2,266
$ 844,623
74%
$ 743,965
61%
(215,760)
$ 528,205
43%
$ 466,932
38%
(248,032)
(3,941)
$ 214,959
18%
FY23 YTD
$ 1,383,454
93,193
$ 1,476,647
$ 994,508
72%
44,047
2,432
$ 1,040,987
75 %
$ 803,034
54%
(187,212)
(17,654)
$598,168
41%
$ 545,933
37%
(285,054)
(5,310)
$ 255,569
17%
32View entire presentation