Main Street Capital Investor Presentation Deck
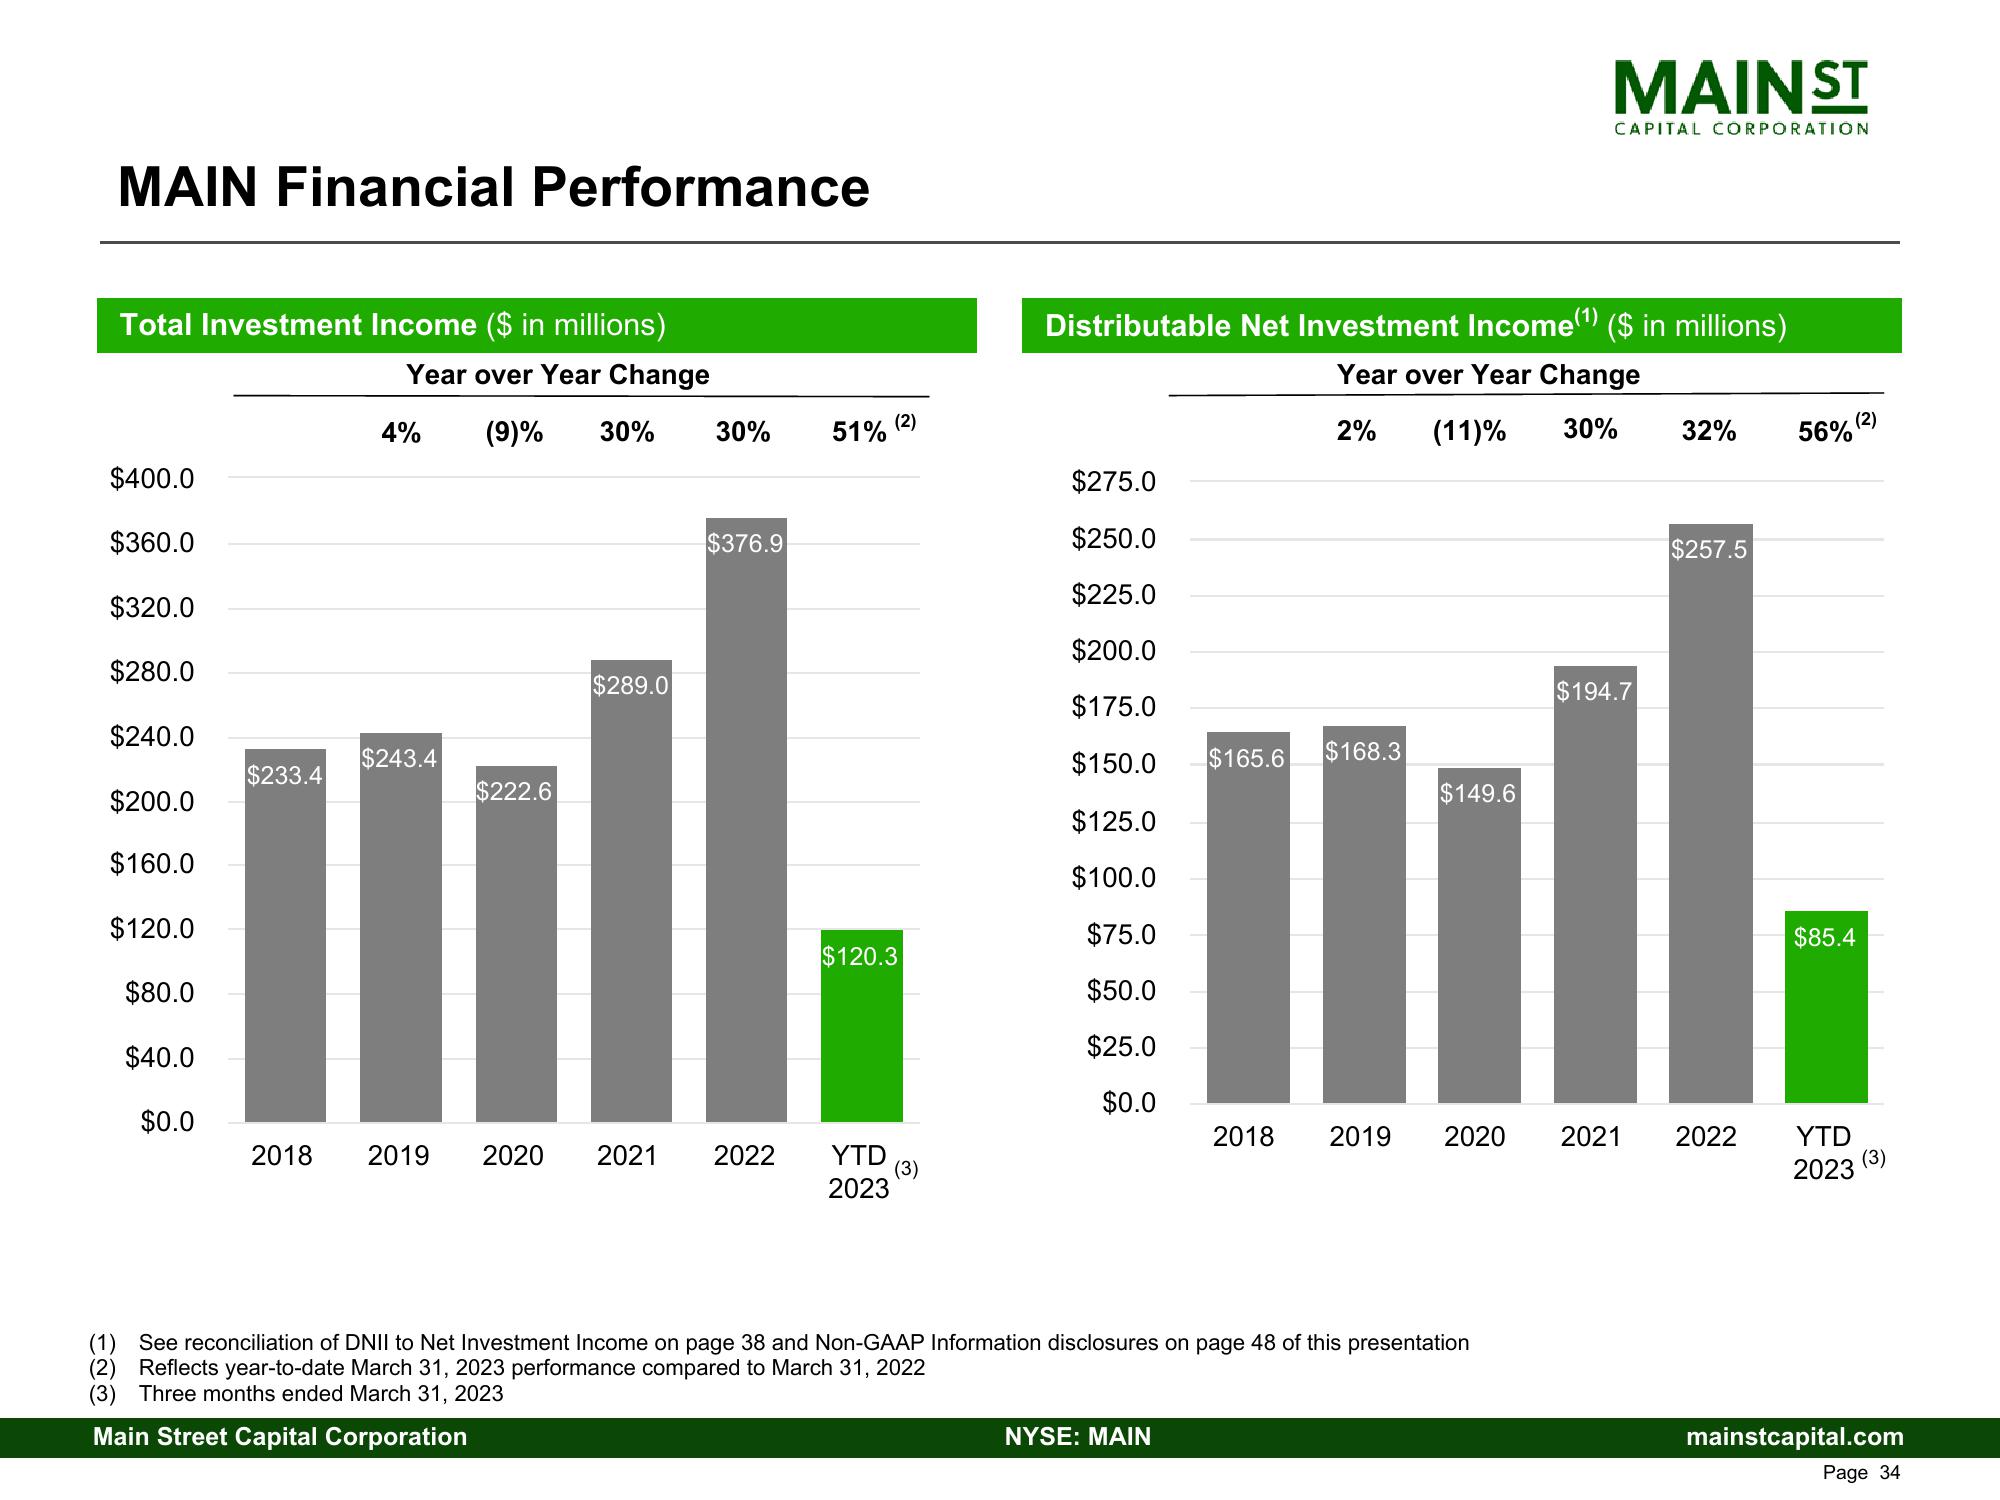
MAIN Financial Performance
Total Investment Income ($ in millions)
Year over Year Change
4% (9)% 30%
$400.0
$360.0
$320.0
$280.0
$240.0
$200.0
$160.0
$120.0
$80.0
$40.0
$0.0
EN
$233.4
$243.4
2018 2019
$222.6
$289.0
30%
$376.9
2020 2021 2022
51%
(2)
$120.3
YTD
2023
(3)
$275.0
$250.0
$225.0
$200.0
$175.0
$150.0 $165.6 $168.3
$125.0
$100.0
$75.0
$50.0
$25.0
$0.0
Distributable Net Investment Income(¹) ($ in millions)
Year over Year Change
2% (11)% 30%
2018 2019
NYSE: MAIN
$149.6
See reconciliation of DNII to Net Investment Income on page 38 and Non-GAAP Information disclosures on page 48 of this presentation
(2) Reflects year-to-date March 31, 2023 performance compared to March 31, 2022
(3) Three months ended March 31, 2023
Main Street Capital Corporation
2020
MAIN ST
CAPITAL CORPORATION
$194.7
2021
32%
$257.5
2022
56% (2)
$85.4
YTD
2023
(3)
mainstcapital.com
Page 34View entire presentation