IGI SPAC Presentation Deck
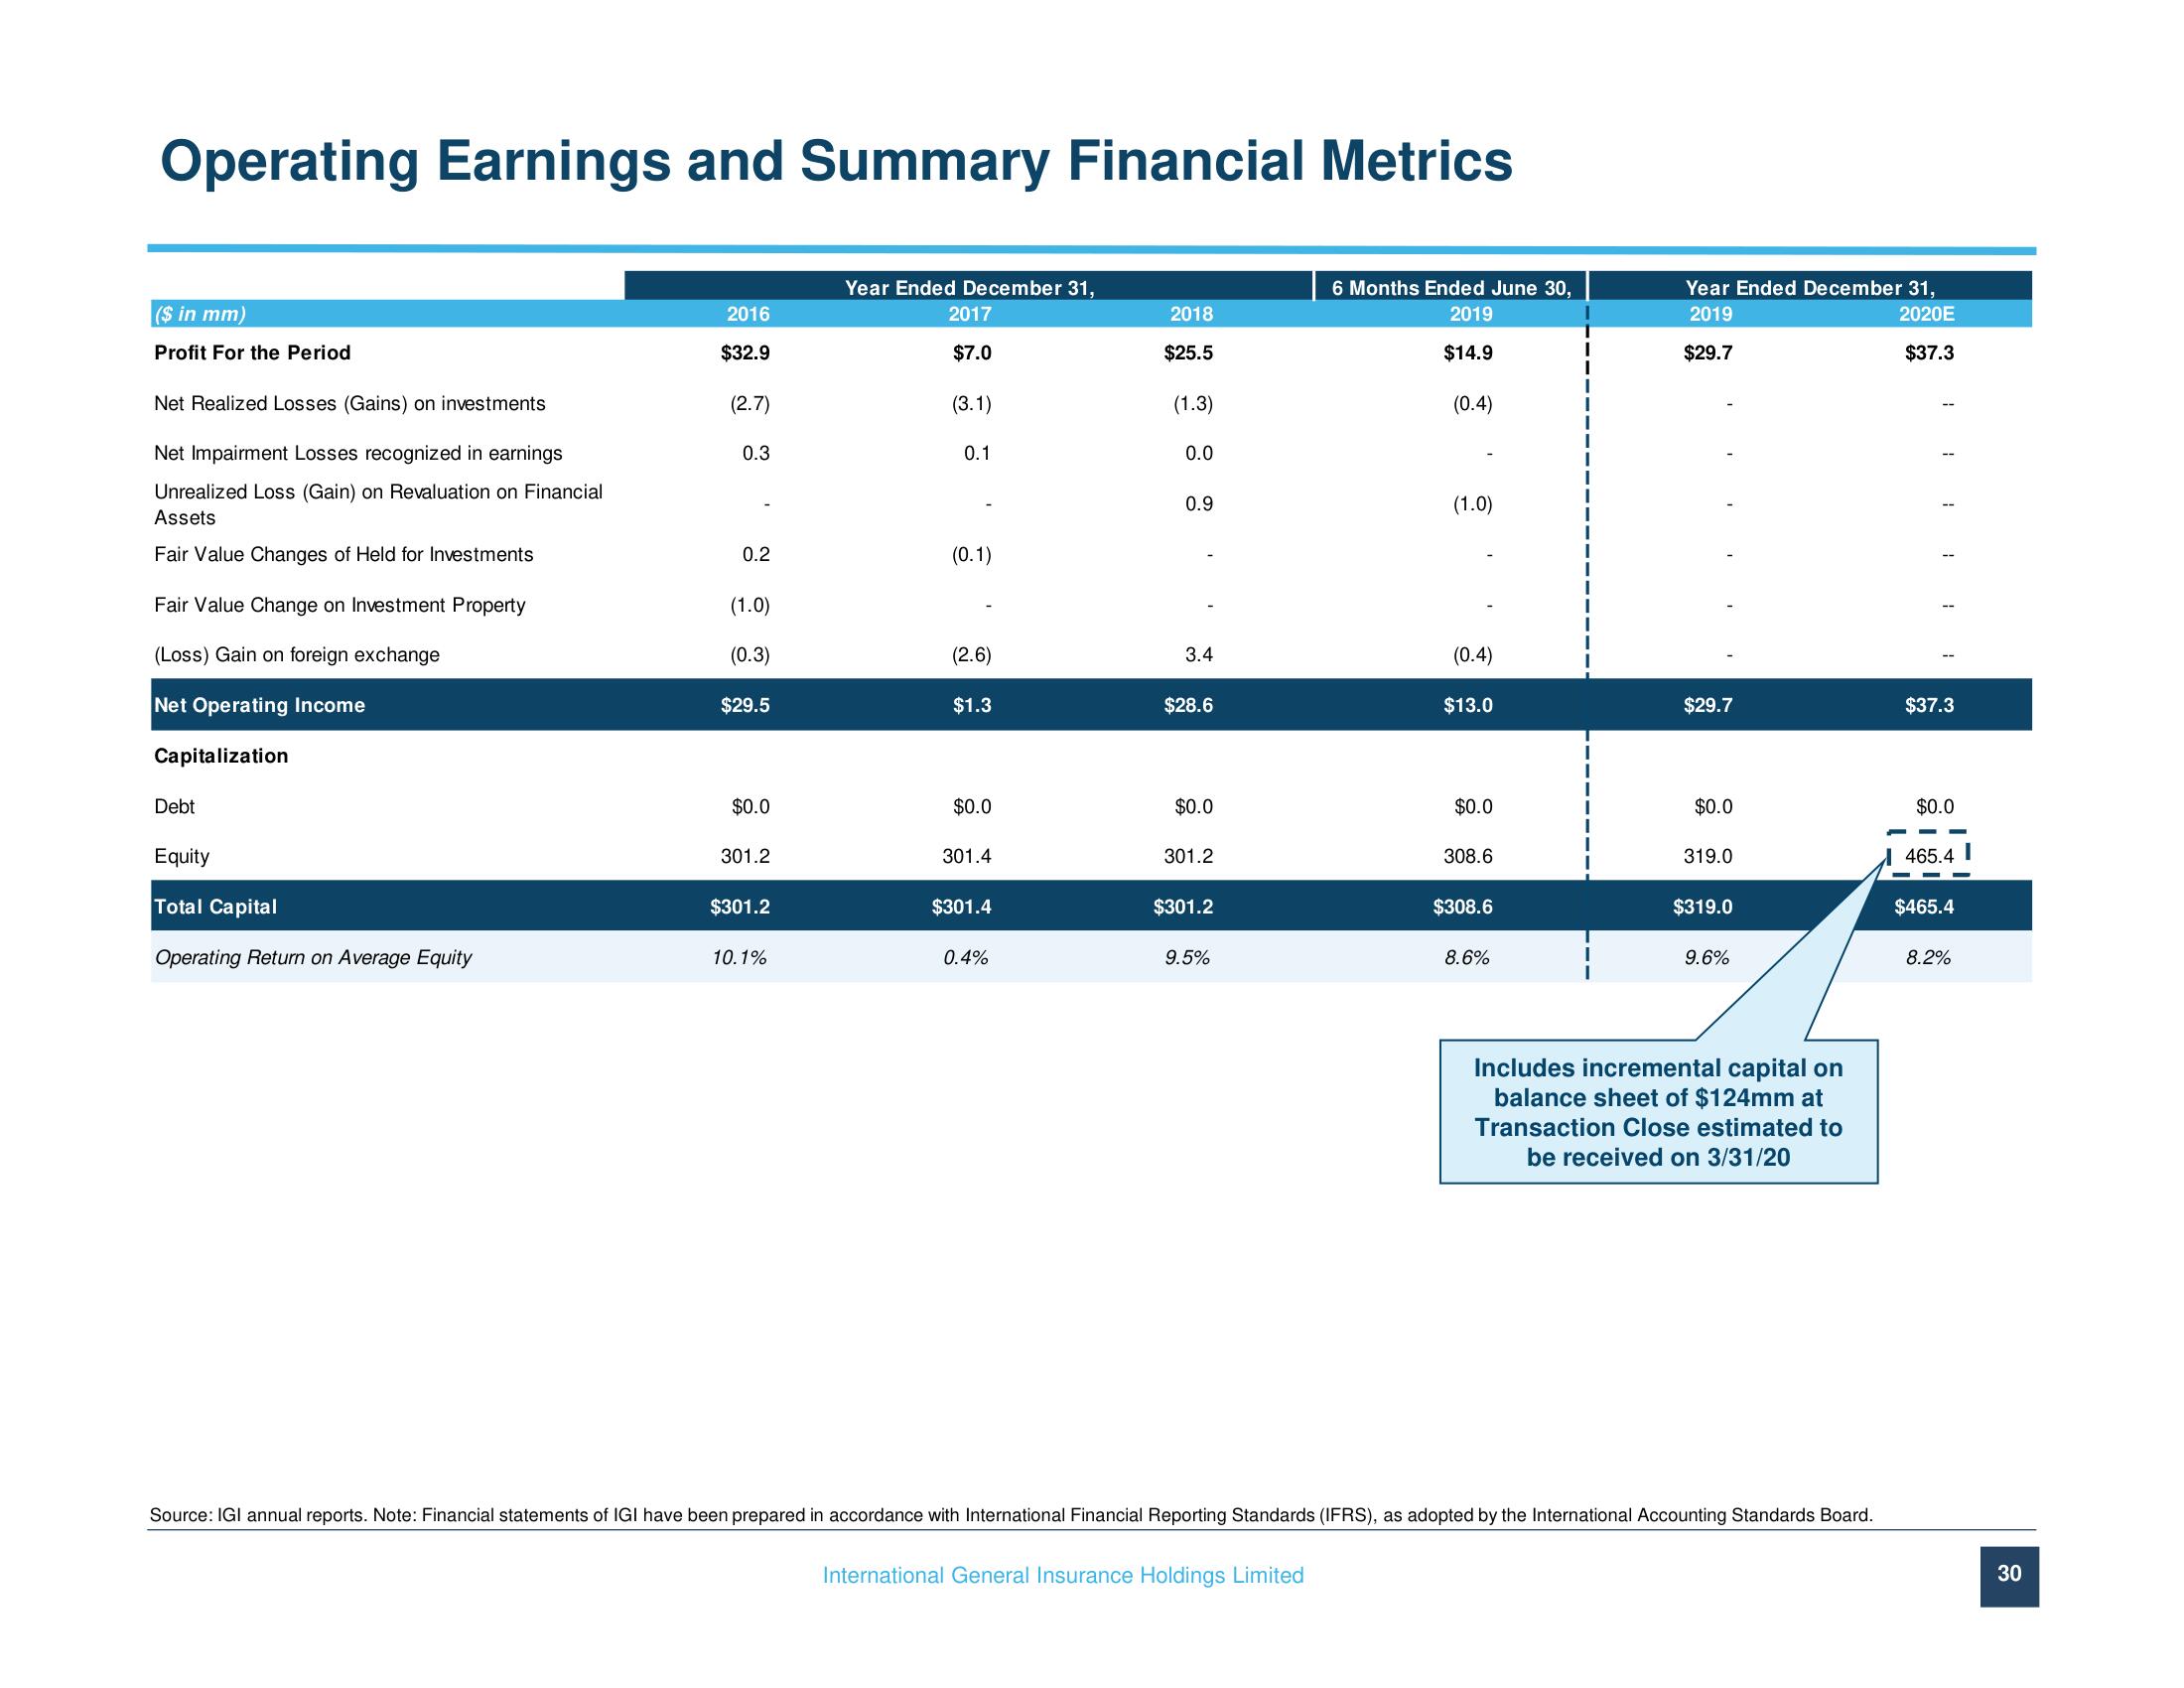
Operating Earnings and Summary Financial Metrics
($ in mm)
Profit For the Period
Net Realized Losses (Gains) on investments
Net Impairment Losses recognized in earnings
Unrealized Loss (Gain) on Revaluation on Financial
Assets
Fair Value Changes of Held for Investments
Fair Value Change on Investment Property
(Loss) Gain on foreign exchange
Net Operating Income
Capitalization
Debt
Equity
Total Capital
Operating Return on Average Equity
2016
$32.9
(2.7)
0.3
0.2
(1.0)
(0.3)
$29.5
$0.0
301.2
$301.2
10.1%
Year Ended December 31,
2017
$7.0
(3.1)
0.1
(0.1)
(2.6)
$1.3
$0.0
301.4
$301.4
0.4%
2018
$25.5
(1.3)
0.0
0.9
3.4
$28.6
$0.0
301.2
$301.2
9.5%
6 Months Ended June 30,
2019
$14.9
International General Insurance Holdings Limited
(0.4)
(1.0)
(0.4)
$13.0
$0.0
308.6
$308.6
8.6%
Year Ended December 31,
2019
2020E
$29.7
$37.3
$29.7
$0.0
319.0
$319.0
9.6%
Includes incremental capital on
balance sheet of $124mm at
Transaction Close estimated to
be received on 3/31/20
Source: IGI annual reports. Note: Financial statements of IGI have been prepared in accordance with International Financial Reporting Standards (IFRS), as adopted by the International Accounting Standards Board.
$37.3
$0.0
465.4
$465.4
8.2%
30View entire presentation