Uber Investor Day Presentation Deck
Financial Framework
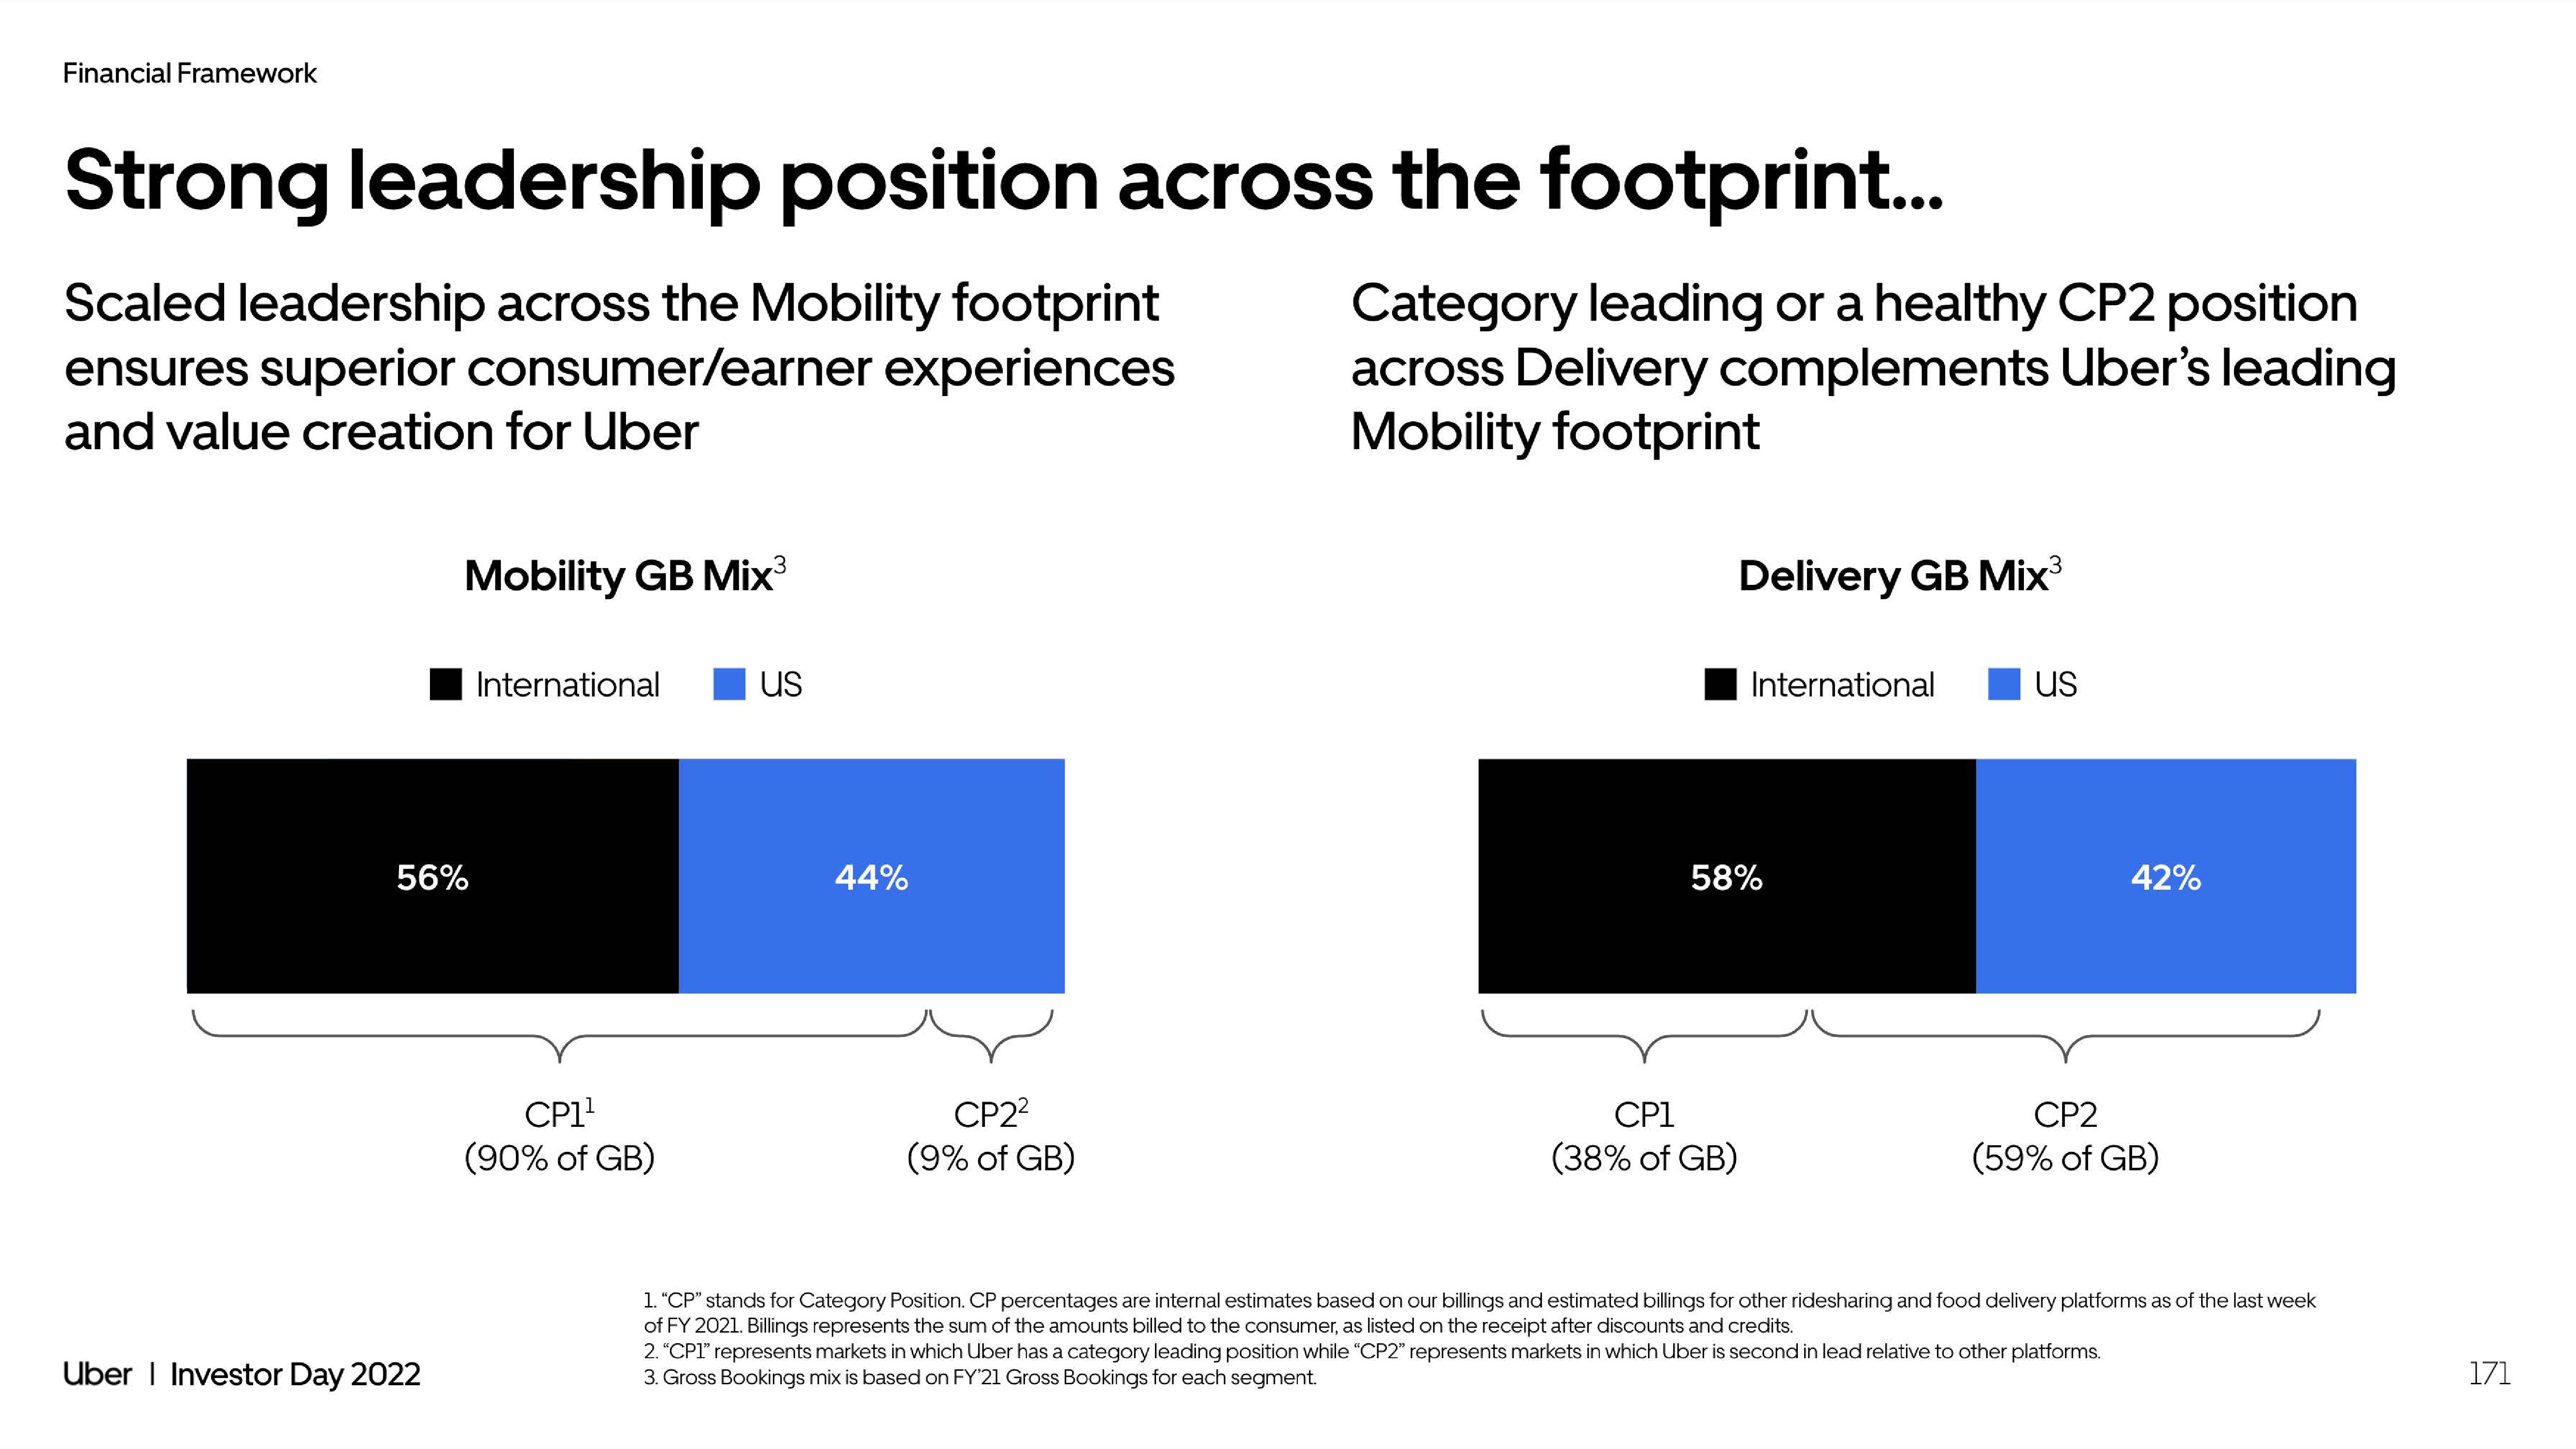
Strong leadership position across the footprint...
Scaled leadership across the Mobility footprint
ensures superior consumer/earner experiences
and value creation for Uber
Mobility GB Mix³
56%
Uber I Investor Day 2022
International
CP1¹
(90% of GB)
us
44%
CP2²
(9% of GB)
Category leading or a healthy CP2 position
across Delivery complements Uber's leading
Mobility footprint
Delivery GB Mix³
CP1
(38% of GB)
International
58%
us
42%
CP2
(59% of GB)
1. "CP" stands for Category Position. CP percentages are internal estimates based on our billings and estimated billings for other ridesharing and food delivery platforms as of the last week
of FY 2021. Billings represents the sum of the amounts billed to the consumer, as listed on the receipt after discounts and credits.
2. "CP1" represents markets in which Uber has a category leading position while "CP2" represents markets in which Uber is second in lead relative to other platforms.
3. Gross Bookings mix is based on FY'21 Gross Bookings for each segment.
171View entire presentation