Investor Presentation
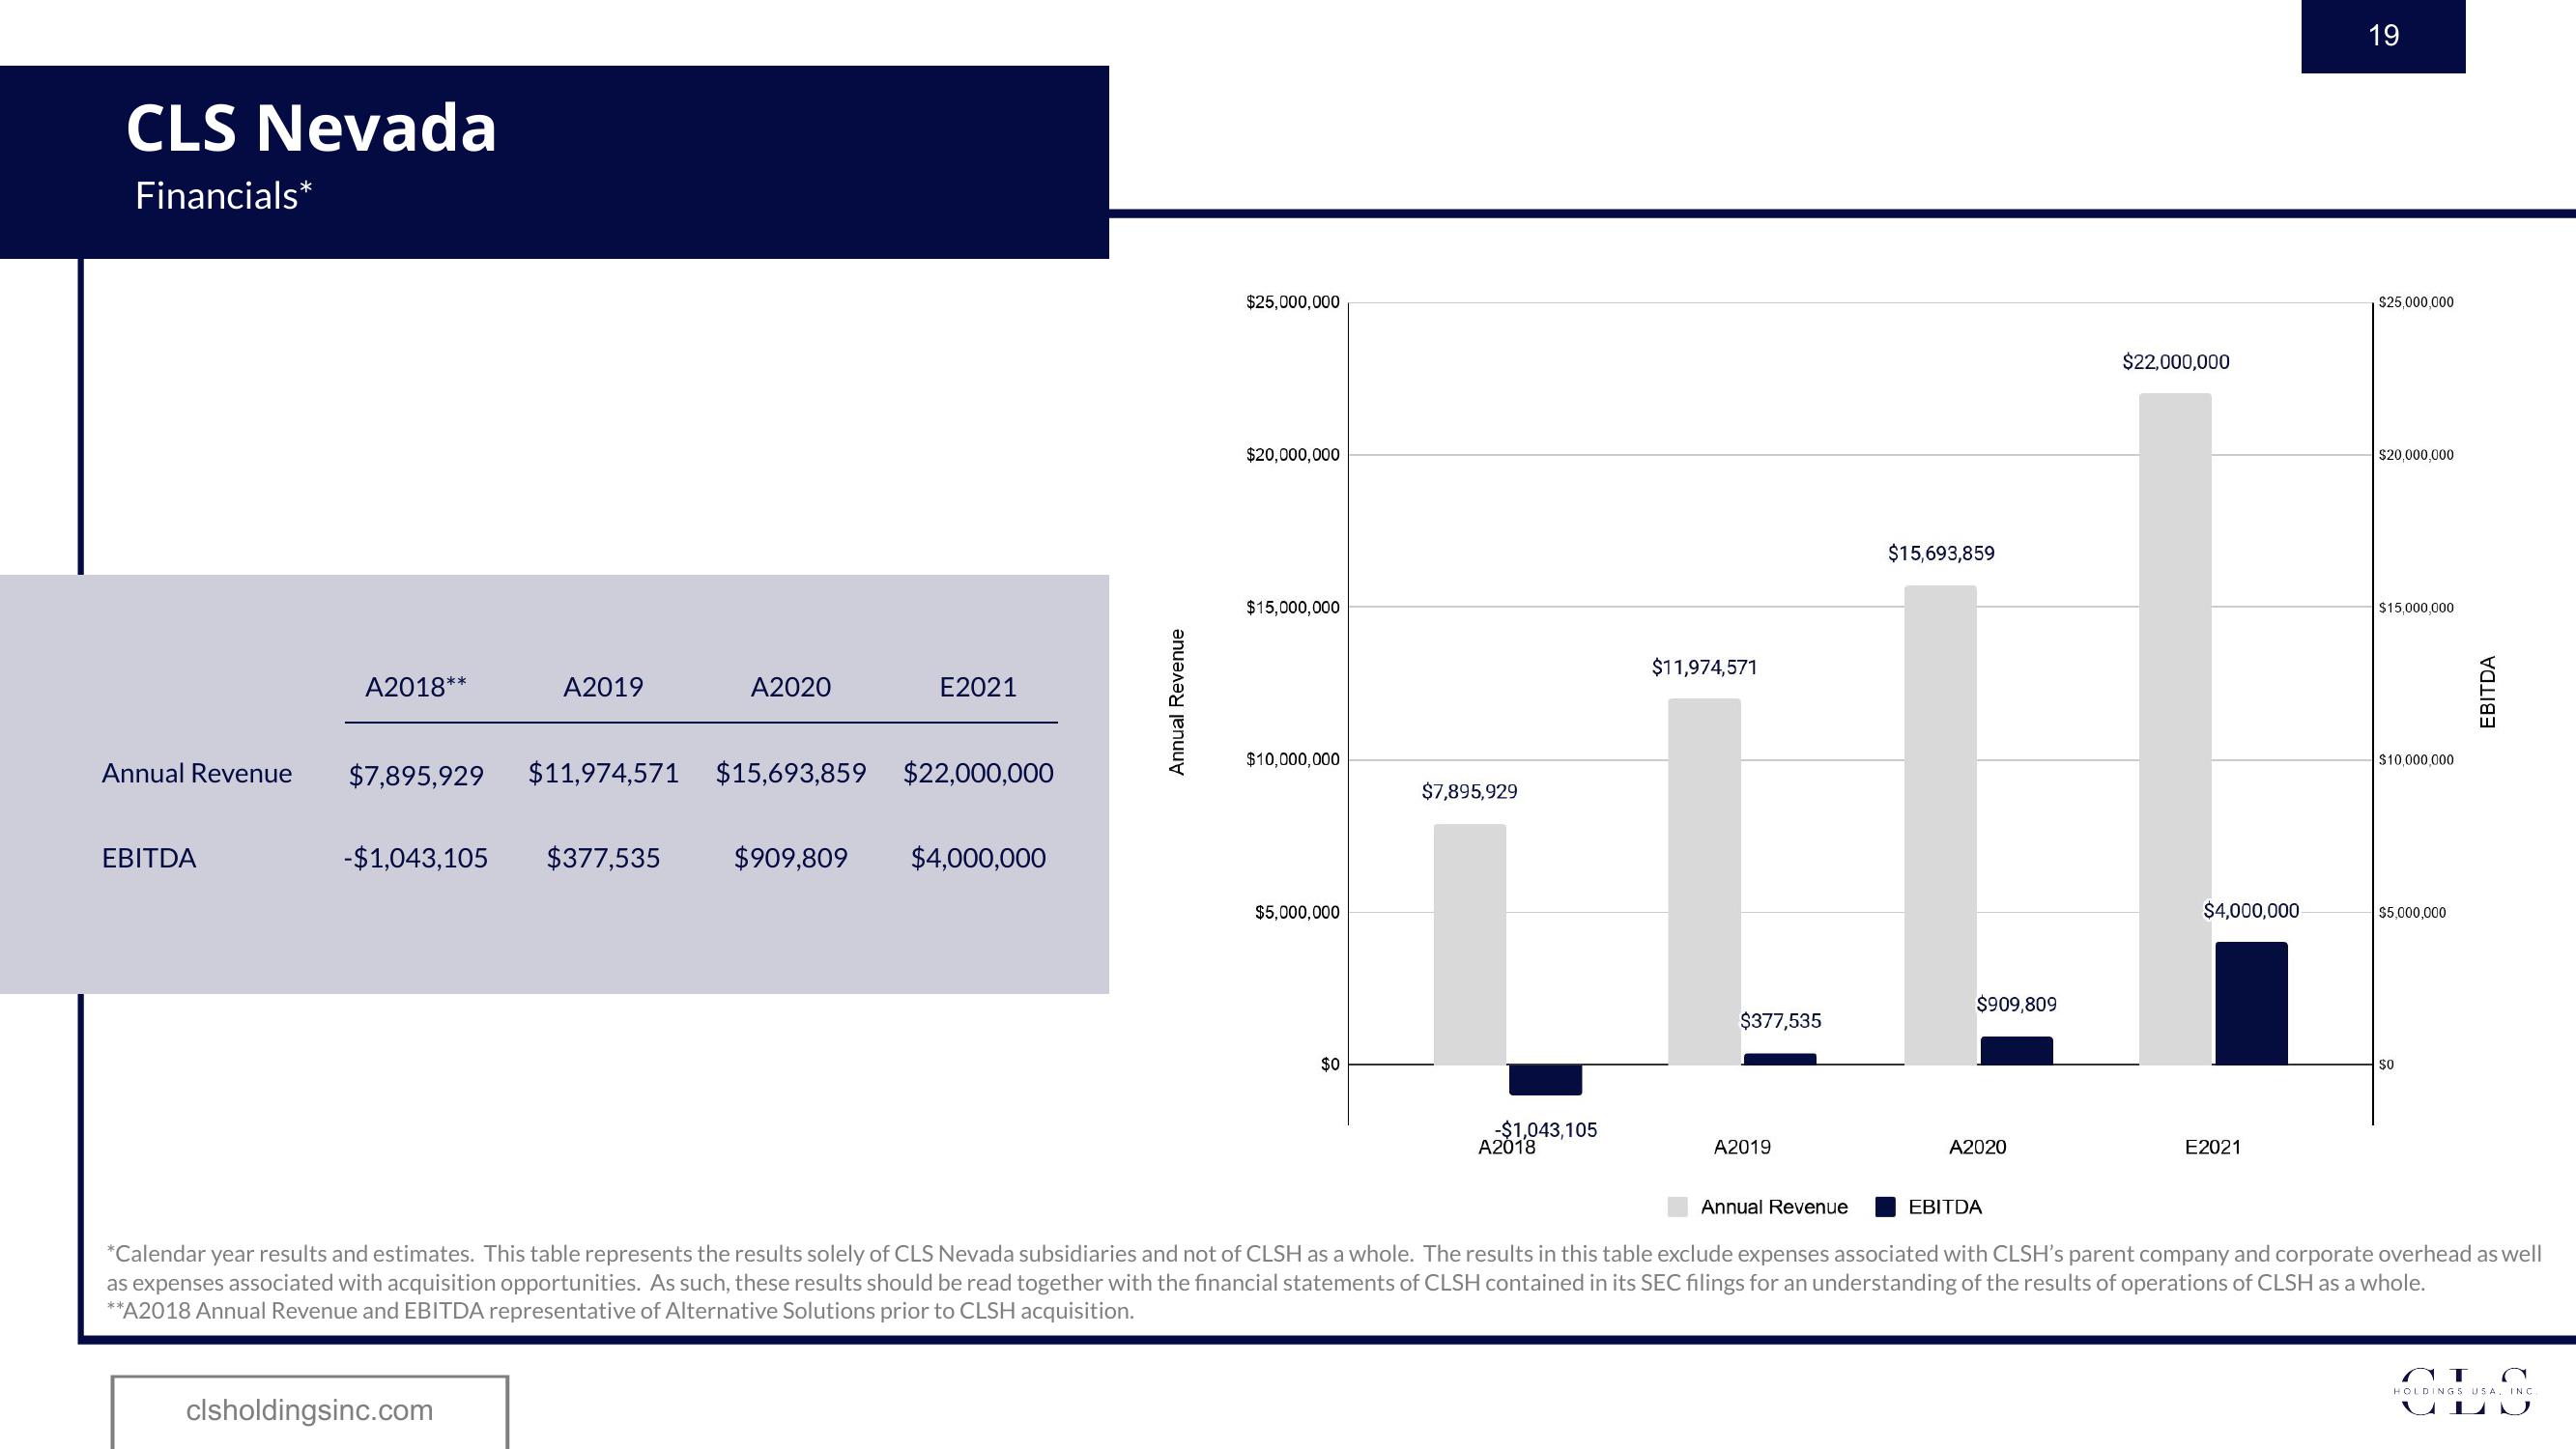
CLS Nevada
Financials*
Annual Revenue
EBITDA
A2018**
A2019
-$1,043,105 $377,535
A2020
$7,895,929 $11,974,571 $15,693,859 $22,000,000
clsholdingsinc.com
E2021
$909,809 $4,000,000
Annual Revenue
$25,000,000
$20,000,000
$15,000,000
$10,000,000
$5,000,000
$0
$7,895,929
-$1,043,105
A2018
$11,974,571
$377,535
A2019
Annual Revenue
$15,693,859
$909,809
A2020
EBITDA
$22,000,000
$4,000,000
E2021
19
$25,000,000
$20,000,000
$15,000,000
$10,000,000
$5,000,000
$0
EBITDA
*Calendar year results and estimates. This table represents the results solely of CLS Nevada subsidiaries and not of CLSH as a whole. The results in this table exclude expenses associated with CLSH's parent company and corporate overhead as well
as expenses associated with acquisition opportunities. As such, these results should be read together with the financial statements of CLSH contained in its SEC filings for an understanding of the results of operations of CLSH as a whole.
**A2018 Annual Revenue and EBITDA representative of Alternative Solutions prior to CLSH acquisition.
AT
HOLDINGS USA, INC.View entire presentation